. 2018 Jan 11;7:e31425. doi: 10.7554/eLife.31425

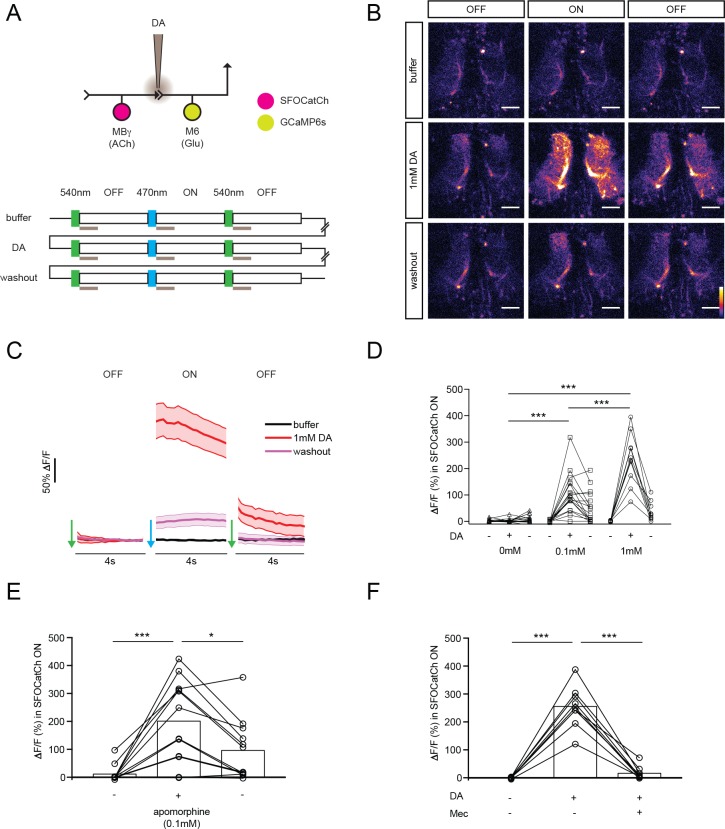
Figure 2. Dopamine modulates synaptic transmission from MBγ to M6 neurons.

(A) Experimental protocol. OFF and ON indicate 4 s imaging periods, preceded by 100 ms pulses of 540 nm or 470 nm light to switch SFOCatCh OFF and ON, respectively. Gray bars indicate 1 s focal perfusion into the γ5 compartment. Buffer, dopamine injection (DA) and washout trials are separated by 3 min intervals. (B) Representative calcium responses in M6 dendrites in the γ5 compartment. Scale bar, 10 μm. (C) Average ΔF/F responses in M6 dendrites. n = 10. Mean ± s.e.m. (D) Average ΔF/F responses during the SFOCatCh ON periods of successive buffer, DA, and washout trials. n = 15, 17, 10 for 0, 0.1, and 1.0 mM DA, respectively. ***p<0.001, t-test. (E) Average ΔF/F responses during the SFOCatCh ON periods of successive buffer, apomorphine, and washout trials. n = 12. *p<0.05, ***p<0.001, t-test. (F) Average ΔF/F responses during the SFOCatCh ON periods of successive trials with buffer only, 1 mM DA, and DA plus 0.15 mM mecamylamine (Mec). n = 9. ***p<0.001, t-test.

Figure 2.

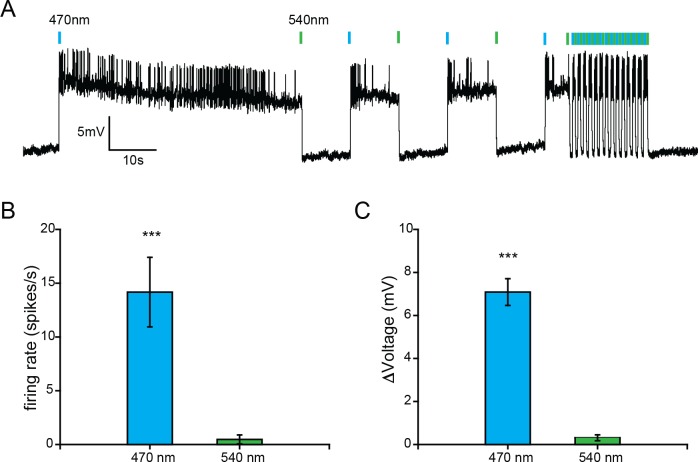
Figure 2—figure supplement 1. SFOCatCh, a step-function optogenetic activator.

Figure 2—figure supplement 1.

(A) Patch-clamp recording from an olfactory projection neuron of a GH146-GAL4 UAS-SFOCatCh male. Blue and green bars indicate 100 ms pulses of 470 nm and 540 nm light. (B) and (C) Firing rate (B), n = 11 cell-attached recordings) and membrane potential (C), n = 4 whole-cell recordings of olfactory projection neurons during the first 5 s after stimulation with 470 nm or 540 nm light. Mean ± s.e.m. ***p<0.001 for comparisons to zero, t-test.
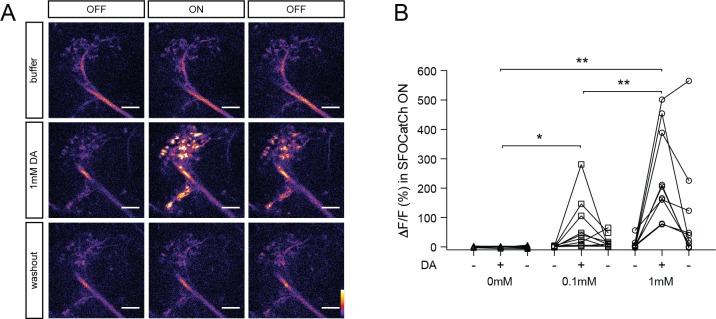
Figure 2—figure supplement 2. Calcium responses in M6 axons upon optogenetic stimulation of MBγ neurons using SFOCatCh.

Figure 2—figure supplement 2.

(A) Representative calcium responses in M6 axons. Experimental protocol as in Figure 2A. Scale bar, 10 μm. (B) Average ΔF/F responses in M6 axons during the SFOCatCh ON periods of successive buffer, DA, and washout trials. n = 11, 10, 9 for 0, 0.1, and 1.0 mM DA, respectively. *p<0.05, **p<0.01, one-way ANOVA test.
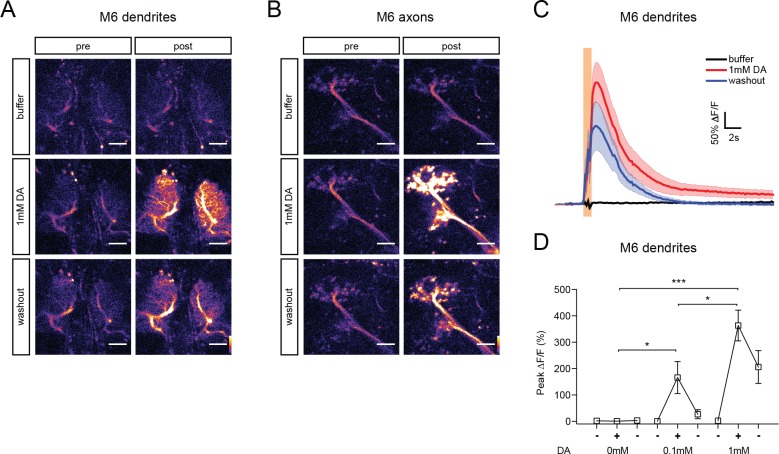
Figure 2—figure supplement 3. Calcium responses in M6 neurons upon optogenetic stimulation of MBγ neurons using CsChrimson.

Figure 2—figure supplement 3.

(A) and (B) Representative calcium responses in M6 dendrites (A) and axons (B) of male brains expressing GCaMP6s in M6 neurons and CsChrimson in MBγ neurons, prior to (pre) and after (post) stimulation with 635 nm LED light Scale bar, 10 μm. Buffer, DA, and washout trials were performed at 3 min intervals. (C) Average ΔF/F responses in M6 dendrites during successive buffer, DA, and washout trials. Light red bar indicates stimulation with 30 2 ms LED pulses at 30 Hz. Mean ± s.e.m. n = 12. (D) Average ΔF/F responses in M6 dendrites during successive buffer, DA, and washout trials. n = 12, 7, 12 for 0, 0.1, and 1.0 mM DA, respectively. *p<0.1, ***p<0.001, one-way ANOVA test.