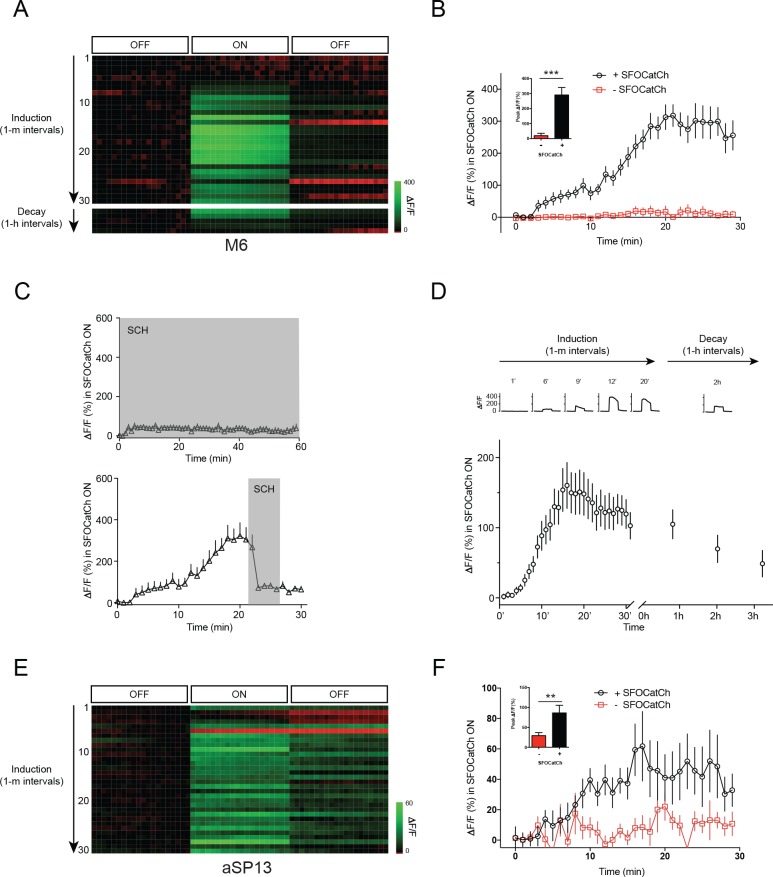
Figure 3. Repetitive stimulation of MBγ potentiates MBγ to M6 transmission.
(A) Representative calcium responses in M6 dendrites in the γ5 compartment upon repetitive optogenetic stimulation of MBγ neurons with SFOCatCh. (B) Time course of average ΔF/F responses in M6 dendrites during potentiation, mean ± s.e.m. n = 16 for +SFOCatCh, n = 6 for –SFOCatCh. Inset, peak ΔF/F responses, mean ± s.e.m. ***p<0.001, t-test. (C) Average ΔF/F responses during the SFOCatCh ON periods in M6 dendrites in the γ5 compartment in trials with SCH23390 present (grey shading) either during (top) or after (bottom) induction. (D) Time course of average ΔF/F responses in M6 dendrites during potentiation (30 stimuli at 1 m intervals) and decay (stimulation at ~1 hr intervals), mean ± s.e.m. n = 19. Top, representative calcium responses at various time points, during the 3 × 4 s OFF/ON/OFF imaging periods. (E) Representative calcium responses in aSP13 axons in the γ5 compartment upon repetitive optogenetic stimulation of MBγ neurons with SFOCatCh. (F) Time course of average ΔF/F responses in aSP13 axons during potentiation, mean ± s.e.m. n = 10 for +SFOCatCh, n = 7 for –SFOCatCh. Inset, peak ΔF/F responses, mean ± s.e.m. **p<0.01, t-test.

