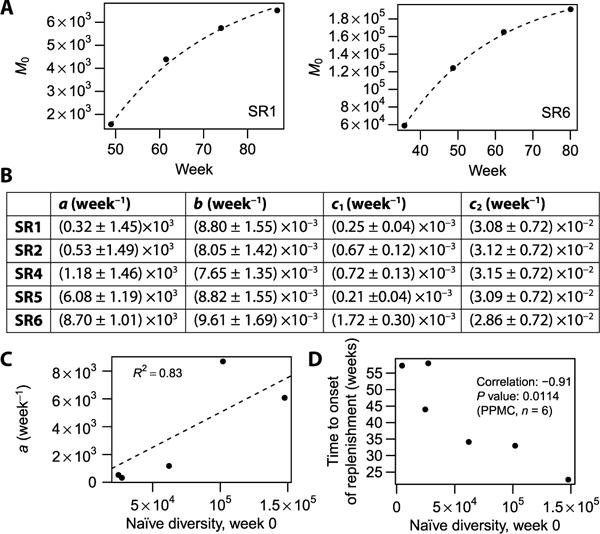
Fig. 4. Quantitative modeling of repertoire replenishment rates.

(A) Fit for the naïve diversity M0 (number of nonmutated IgM sequences, Chao1 estimate) as a function of time, after the onset of replenishment. Only the two participants (SR1 and SR6) with the largest numbers of corresponding time points are shown. Numeric data values are also provided in table S3. (B) Fit parameters describing sequence generation (a), mutation (b), class switch (c1), and apoptosis (c2) rates. SR1 to SR6 are labels for individual participants. Participant SR3 is omitted because an insufficient number of time points after the onset of depletion were available. (C) Baseline naïve diversity versus naïve generation rate. R2 value is for the linear fit shown by the dashed line performed with intercept set to 0. Numeric data values are also provided in table S4. (D) Baseline naïve diversity versus time to onset of replenishment (defined as the interval between second visit and the earliest visit exhibiting more than 5000 distinct IGH sequences). Numeric data values are also provided in table S5. PPMC, Pearson product-moment correlation.
