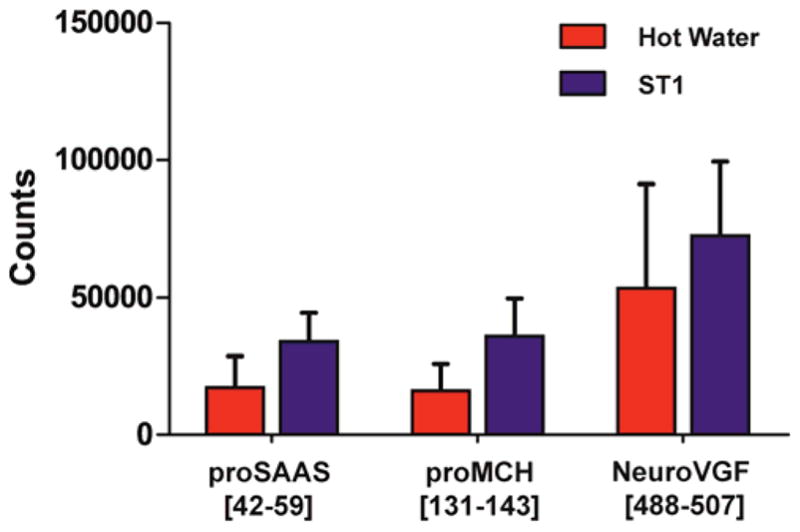
Figure 4.

Comparison of relative levels of selected neuropeptides detected in extracts of ST1- and hot water-stabilized SCN samples. Integrated peak areas on the MRM channels of proSAAS[42–59], proMCH[131–143], and neuroVGF [488–507] are calculated and compared (proSAAS paired comparison, p=0.018; neuroVGF paired comparison, p=0.012). Error bars represent standard deviation.
