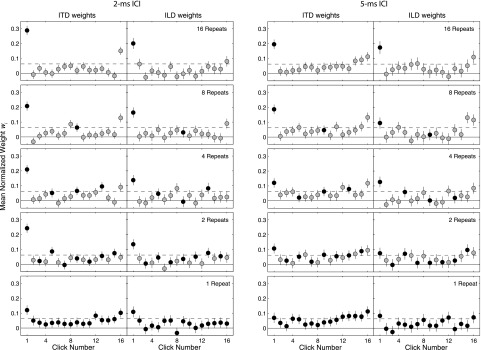
FIG. 2.
The TWFs for noise-burst trains (Experiment 1). Each panel plots mean normalized weight wi (y-axis), as a function of the temporal order of the clicks (x-axis) with ITD and ILD weights in separate panels (left/right column in each group). Error bars indicate bootstrapped 95% confidence intervals. The dashed horizontal line in each panel indicates the value that would be obtained if all clicks were equally weighted (1/16), while the solid line indicates zero. From top to bottom, panels plot TWFs for noise-burst trains with noise tokens repeating across 16 (top), 8, 4, 2, or 1 (bottom) sequential bursts. The initial presentation of each new noise token is indicated by a filled symbol; subsequent repeat presentations are indicated by open (gray) symbols. Two columns at left plot TWFs for lateralization at 2-ms ICI; columns at right plot TWFs obtained at 5-ms ICI.

