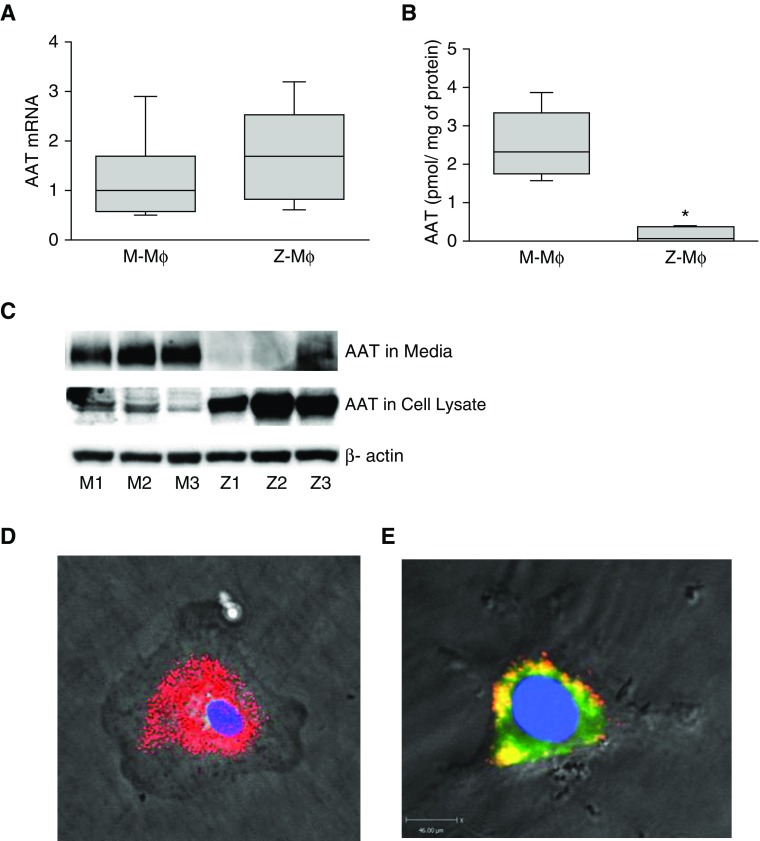
Figure 1.
Alpha-1 antitrypsin (AAT) production by M- and Z-macrophages (Mɸ). (A) Comparison of AAT mRNA expression levels in M- and Z-Mɸ. AAT mRNA was measured by real-time PCR (n = 6 individuals for each group) and normalized to 18S. (B) AAT protein levels in conditioned media from M- and Z-Mɸ (n = 3 individuals for each group) were measured by ELISA after 8 hours of incubation. (C) Immunoblot of AAT in conditioned media and cell lysates from M- and Z-Mɸ (n = 3 individuals for each group). *P < 0.05. (D and E) Images of Z-Mɸ infected with Z–alpha-1 antitrypsin Z-AAT tagged with red fluorescent protein (Z-AAT)-RFP/AAV6-Y705-731F. (E) To show ER localization of intracellular Z-AAT, cells were additionally stained with ER marker, disulphide isomerase (PDI; FITC-labeled secondary antibody). Yellow area represents colocalization of PDI and Z-AAT–RFP. Scale bar, 45 μm. Images were taken at magnification ×40.

