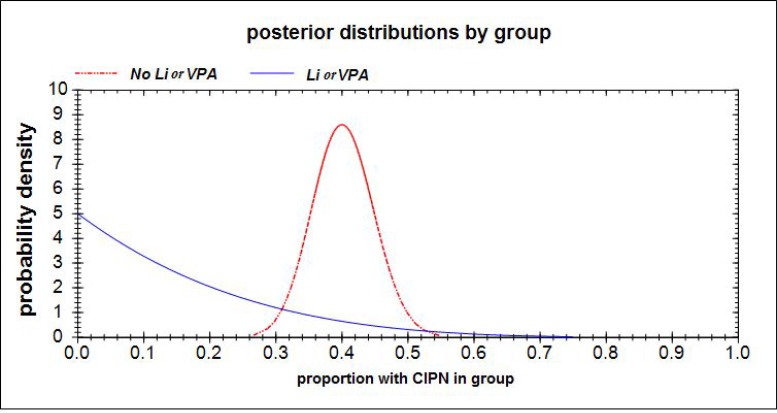
Figure 2. Based upon a non-informative prior probability distribution Beta(1, 1) for both p1 (the proportion of CIPN in the “No Li or VPA” group) and p2 (the proportion of CIPN in the “Li or VPA” group), and new information from the chart review of 0 CIPN of 4 in Li + VPA group and 44 CIPN of 100 in the “No Li or VPA” group, the respective posterior probability distributions for the group CIPN proportions are p1∼Beta(1, 5) and p2∼Beta(45, 67).
These posterior distributions for p1 and p2 are represented by the red and blue curves, respectively.

