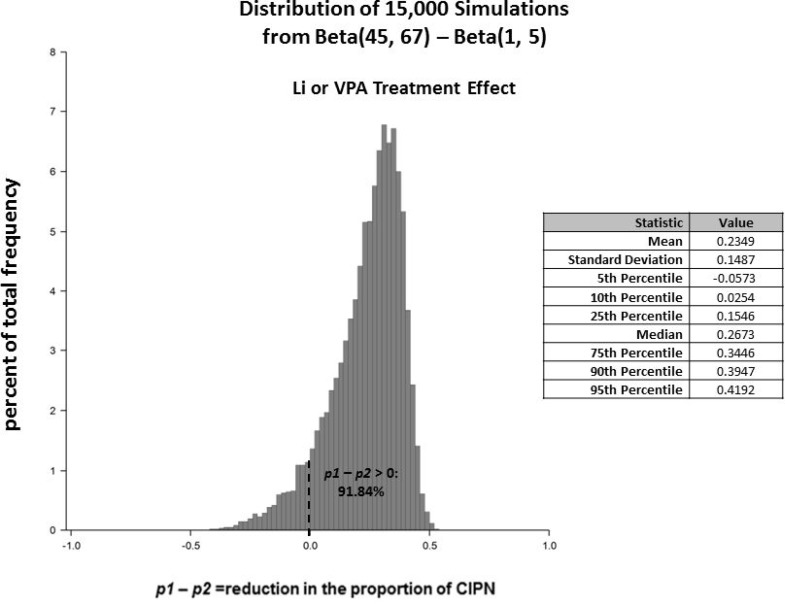
Figure 3. The posterior probability distribution for the “Li or VPA” treatment effect is p2 – p1 ∼ Beta(45, 67)-Beta(1, 5).
This probability distribution was generated from 15,000 simulated random draws and is shown along with summary statistics. The area under the curve to the right of p2 – p1 > 0 represents the probability that the “Li or VPA” group has lower risk of CIPN than the “No Li or VPA” group.

