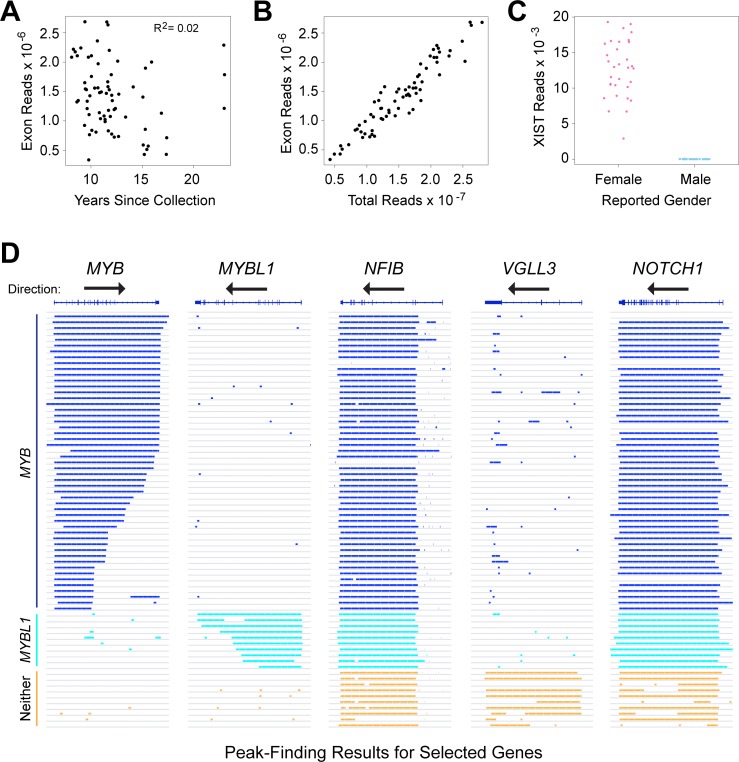
Figure 1. RNA-seq identifies distinct subgroups of ACC tumor samples.
(A) Plot of years since samples were collected vs. RNA-seq reads mapped to exons in the reference genome shows that high-quality results were obtained with samples collected up to 24 years ago, and that quality did not correlate with the age of the samples. (B) Plot of total RNA-seq reads vs. exon mapped reads, one of the quality control measures employed in this study. (C) Plot of reads mapped to the XIST gene as a function of reported gender in the associated clinical data. This quality control step is useful to identify mislabeled samples. (D) Genome browser representation of peak-calling results generated from ACC tumor sample RNA-seq data for the genes indicated. Gene names and exon/intron structures are at top, arrows show the direction of transcription, each horizontal line or track is a different ACC sample, ordered to cluster the samples with similar gene expression patterns and colored bars indicate regions of transcription detected by the peak-calling algorithm. Note that the MYB gene is transcribed left-to-right, but the others are right-to-left. Samples that express MYB (dark blue), MYBL1 (cyan) or neither oncogene (orange) are labeled at left.

