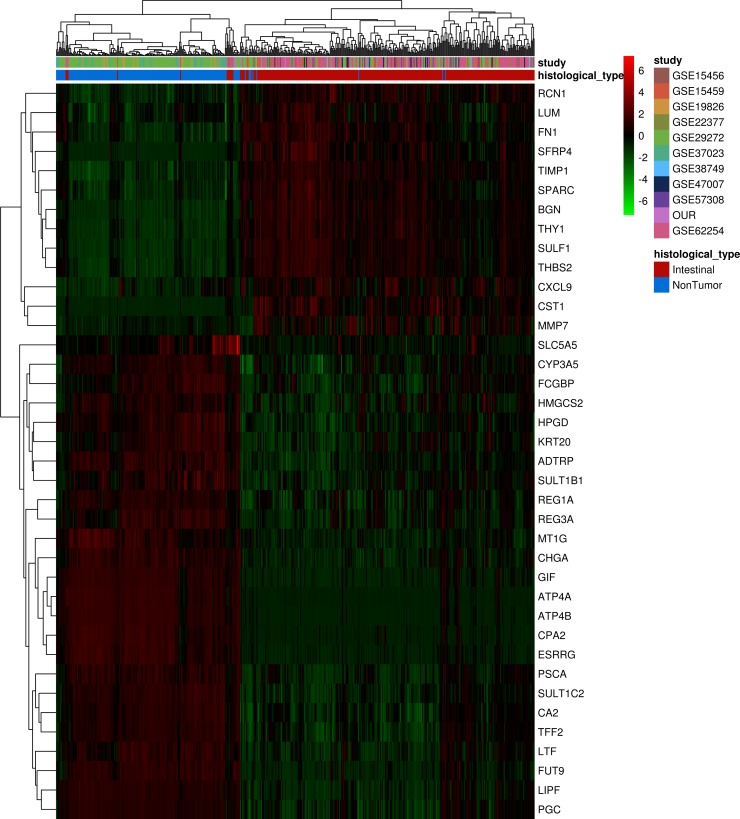
Figure 3. Unsupervised analysis of differentially expressed genes found in Brazilian patients with intestinal-type gastric carcinoma in different populations samples.
Hierarchical clustering of samples using 38 genes differentially expressed between non-tumor and tumor samples from different studies. Each row represents a gene, and each column represents a sample. The expression level of each gene in a single sample is relative to its median abundance across all samples and is depicted according to a color scale shown at the right. Red and green indicate expression levels above and below the median, respectively. The magnitude of deviation from the median is represented by the color saturation. Dendrograms of samples (above matrix) and genes (to the left of matrix) represent overall similarities in gene expression profiles. For samples, blue boxes represent non-tumor tissue (n = 190), and red boxes represent cancerous tissue (n = 312). Colored boxes represent datasets from different studies showed in Table 1.

