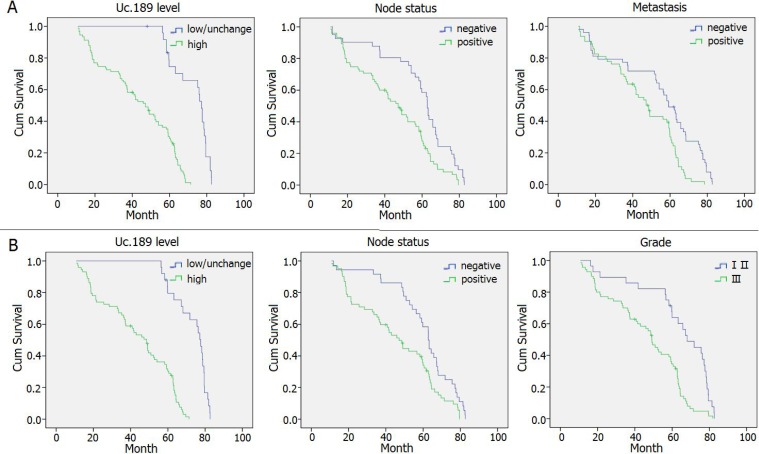
Figure 2. Survival curves in patients with CSCC and EAC according to uc.189 levels.
(A) Overall survival curves in patients with CSCC according to uc.189 levels, node status and metastasis (P < 0.05). (B) Overall survival curves in patients with EAC according to uc.189 levels, node status and tumor grade (P < 0.05).

