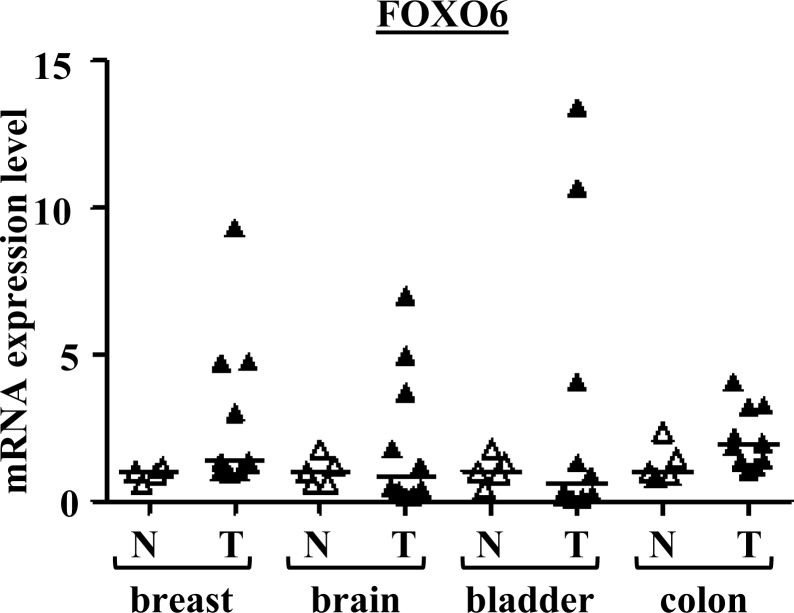
Figure 1. FOXO6 mRNA expressions in various cancers and normal tissues.
Scatter dot plot with median of qRT-PCR data for FOXO6 in the series of breast, brain, bladder and colon tissues (n = 5 normal tissues and n = 10 tumour tissues for each). p-values (Mann-Whitney U Test) are indicated: *, 0.01 < p-value < 0.05; **, p-value < 0.01.

