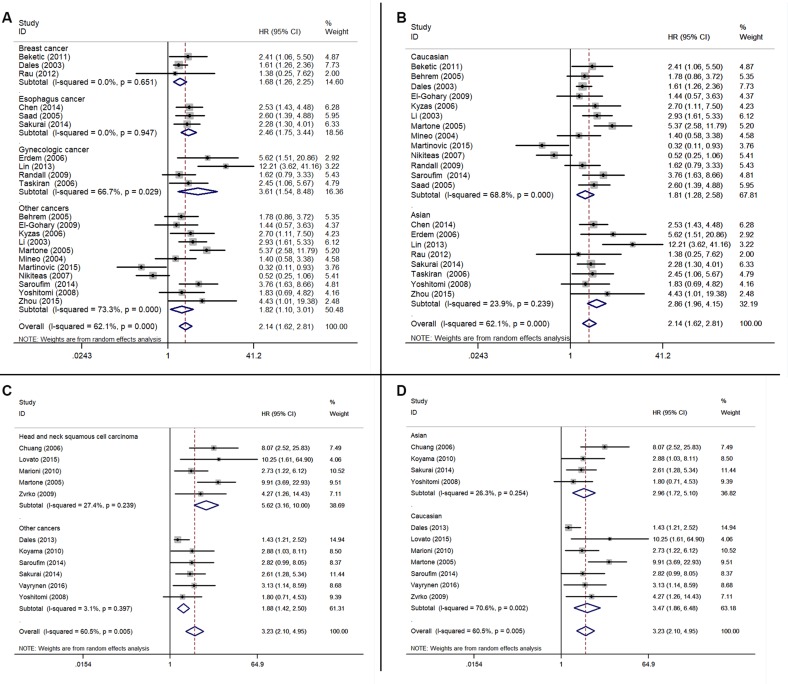
Figure 4. Forest plots showing the subgroup analyses of the relationship between the elevated endoglin-MVD expression and OS/DFS.
(A) Subgroup analysis of different cancer types for OS. (B) Subgroup analysis of the origin of patients for OS. (C) Subgroup analysis of different cancer types for DFS. (D) Subgroup analysis of the origin of patients for DFS. A square represents a single study; the centre shows the HR with the horizontal lines denoting the 95% CIs. The diamond represents the overall HR for combined results of subgroup study; the centre shows the HR and the extremities show the 95% CIs. HR, hazard ratio; CI, confidence interval.

