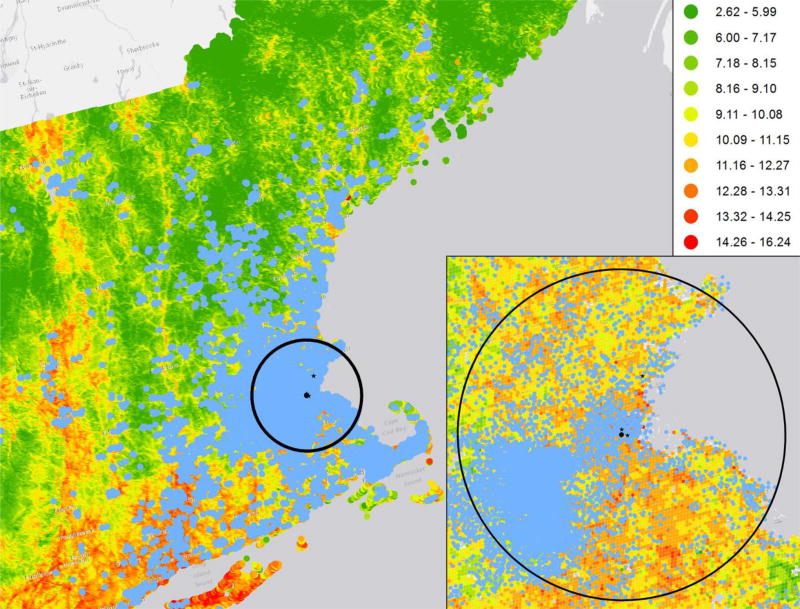
Figure 1.
Map of the study region showing the distribution of the study participants, the model-based 2003 annual average PM2.5 concentrations (µg/m3), and the locations of Supersite and local state monitors. To protect the confidentiality of the participants, the residential locations on the map were masked by altering the longitude and latitude by a small random amount. Thus, although these locations are representative of the distribution of participants’ residential locations, none of them represent actual residential locations of the study participants. Circle indicates the 50 km radius from Supersite. Blue dots: residential locations of the study participants. Black dot: Supersite. Black star: local state monitors.

