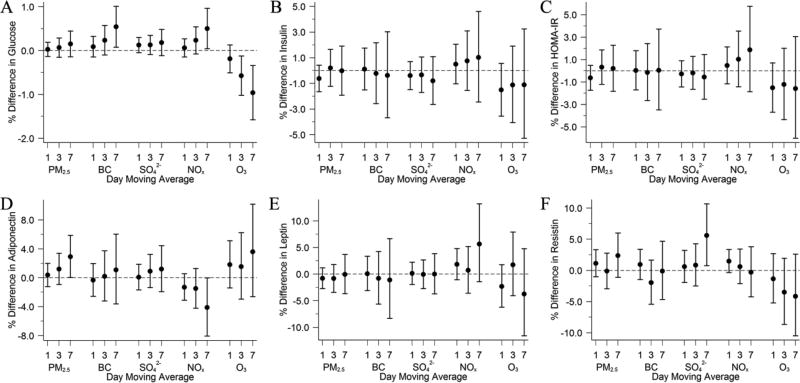
Figure 3.
Associations of 1-, 3-, and 7-Day Moving Averages of Air Pollutants With A) Fasting Glucose, B) Insulin, C) HOMA-IR, D) Adiponectin, E) Leptin, and F) Resistin Among Participants From the Framingham Offspring Cohort Examination 7 (1998–2001), Examination 8 (2005–2008), Third Generation Cohort Examination 1 (2002–2005), or Examination 2 (2008–2011). Models were adjusted for centered age, (centered age)2, sex, body mass index, smoking status, pack years, alcohol intake, educational attainment, physical activity, census tract median household income, census tract median value of owner occupied housing units, census tract population density, usual occupation, date of examination visit, sine and cosine season, day of week, temperature, and relative humidity. An exam identifier was added for glucose, insulin, HOMA-IR, and adiponectin. Results were scaled to 5 µg/m3 for fine particulate matter (PM2.5), 0.5 µg/m3 for black carbon (BC), 2 µg/m3 for sulfate (SO42−), 20 ppb for nitrogen oxides (NOx), and 15 ppb for ozone (O3). Error bars indicate the 95% confidence intervals.

