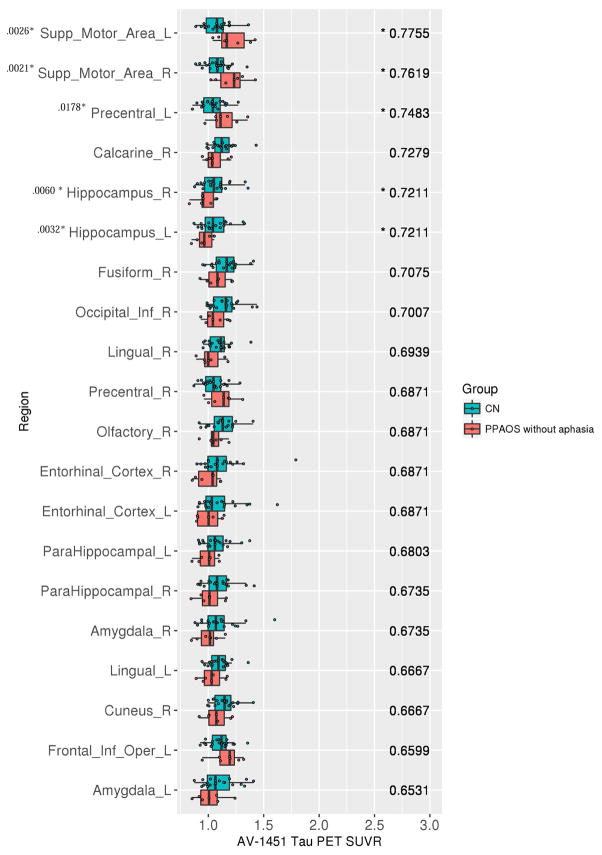
Figure 6.
Tau-PET SUVrs (x-axis) and the associated top 20 AUROCS (y-axis), ranked from highest to lowest AUROC (value listed in the right side of each panel), for controls against PPAOS patients without aphasia. Note: A * by AUROC value denotes those whose 95% confidence interval excludes 0.5. A * by region name indicates significant group differences (p < .05, adjusted for multiple comparisons) on Wilcoxon rank sum test; p-value is provided.

