
Figure 1. Flow diagram of the TCR:p:MHCII modelling pipeline and the cross-validation.
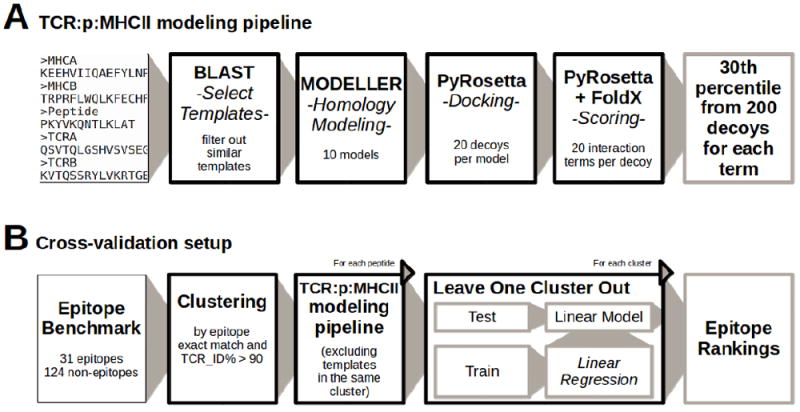
A) The pipeline input consists in a set of 5 sequences corresponding to MHC alpha and Beta subunits, the peptide sequence and TCR alpha and beta chains, and outputs a set of percentile values that describe the interaction energies between TCR and p:MHC using 200 models. B) The setup validates the pipeline splitting the set of epitopes in clusters and leaving one cluster out at a time. It models each peptide excluding the templates in the same cluster during the modelling step and also the percentile values when the model is trained. Finally, each cluster is tested separately avoiding the effect of overfitting.