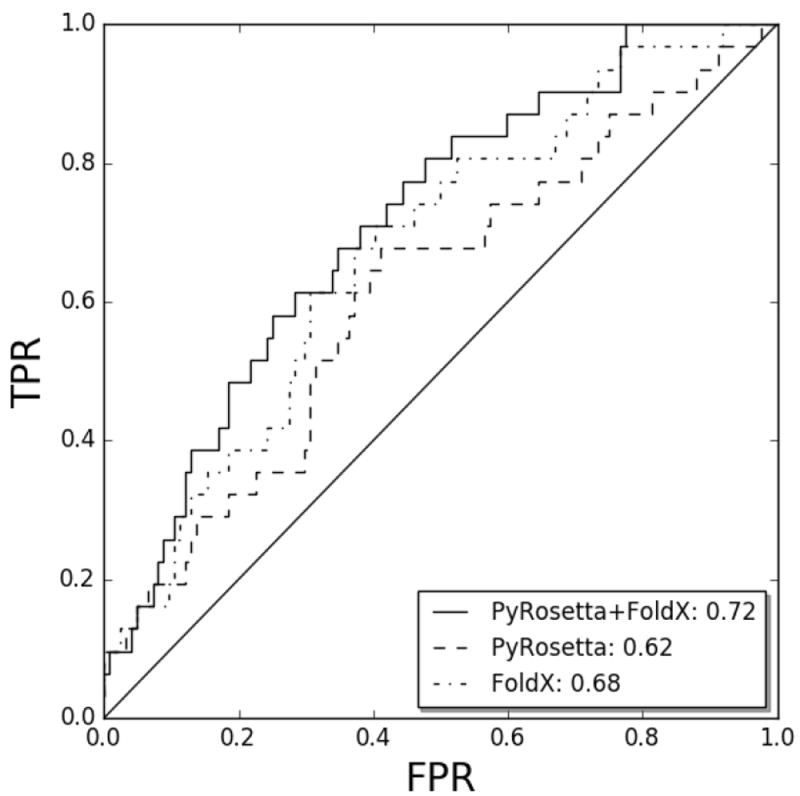
Figure 2. Global prediction performance.

ROC curves for the prediction performance using different sets of terms to fit linear models. All terms together are depicted in solid line, PyRosetta terms in dashed line and FoldX terms in dotted line. FPR: False positive proportion, TPR: True positive proportion. The x=y diagonal is included as a reference corresponding to random predictions.
