
Figure 1.
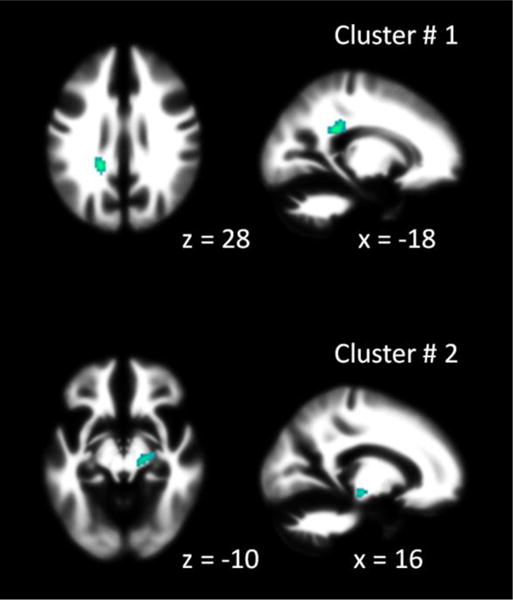
Regions that showed consistent fractional anisotropy (FA) reduction in individuals with autism spectrum disorder (ASD) compared with typically developing (TD) individuals. The x or z values under each slide indicates x or z coordinates in MNI space (Montreal Neurology Institute). Cluster numbers correspond to what reported in Table 3.