
Figure 5. Human cells from ALS patients exhibit defects in NPC and nuclear lamina morphology and nucleocytoplasmic transport.
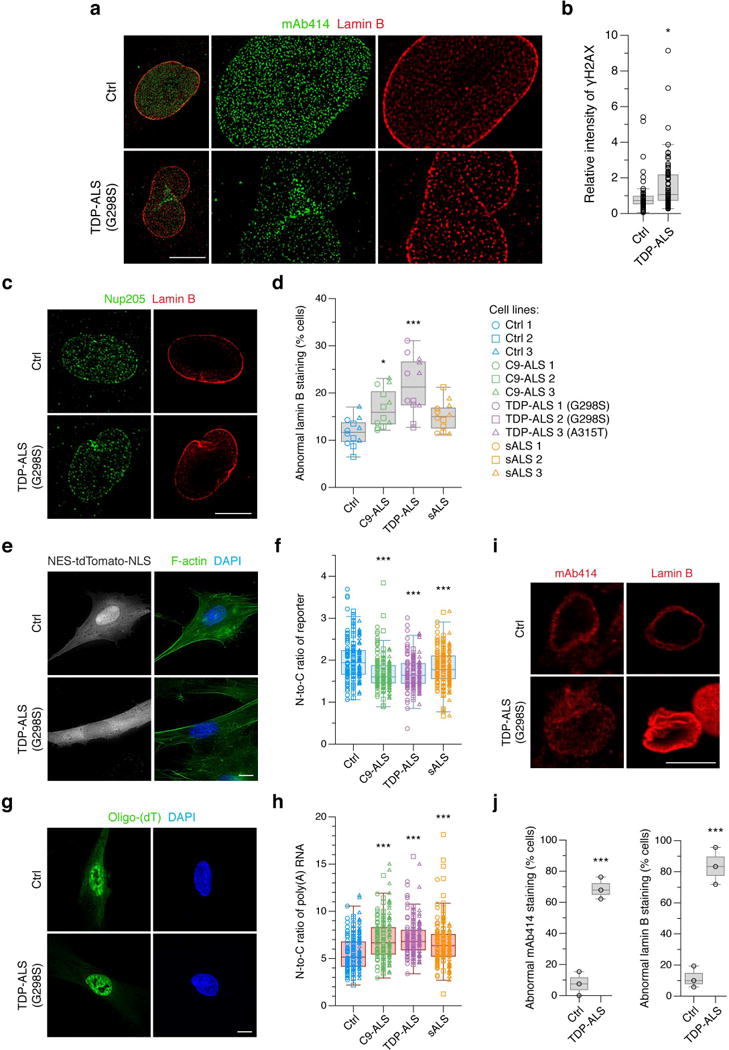
a, Super-resolution immunofluorescence (IF) imaging of endogenous FG-Nups (mAb414, green) and lamin B (red) in fibroblasts from healthy control (Ctrl) and TDP-ALS. This was repeated independently three times with similar results. Scale bar: 10 μm. b, IF and quantification of mean anti-γH2AX intensity. c, d, IF of endogenous Nup205 (green) and lamin B (red) (c) and quantification of cells with abnormal lamin B staining in fibroblasts from three Ctrl, C9-ALS, TDP-ALS and sALS cases (d). Scale bar: 10 μm. e, f, IF and quantification of N-to-C ratio of a transport reporter. Scale bar: 10 μm. g, h, IF and quantification of N-to-C ratio of poly(A) RNA. Scale bar: 10 μm. i, j, IF and quantification of cells with abnormal FG-Nups and lamin B staining in iPSC-derived motor neurons from Ctrl and TDP-ALS. Scale bar: 10 μm. Graphs represent quartiles (boxes) and range (whiskers). Five independent experiments for b (circles represent Ctrl: n = 51, TDP-ALS: n = 62; * P < 0.05, two-sided unpaired t-test), four independent experiments for d (symbols represent each independent experiment per cell line; * P < 0.05, *** P < 0.001, one-way ANOVA), four independent experiments for f (symbols represent Ctrl: n = 178, C9-ALS: n = 175, TDP-ALS: n = 183, sALS: n = 180; *** P < 0.001, one-way ANOVA), four independent experiments for h (symbols represent Ctrl: n = 186, C9-ALS: n = 180, TDP-ALS: n = 190, sALS: n = 181; *** P < 0.001, one-way ANOVA) and triplicates for each group for j (symbols represent each independent experiment; *** P < 0.001, two-sided unpaired t-test). Bonferroni’s post hoc test. Full statistical details are provided in Supplementary Table 4.