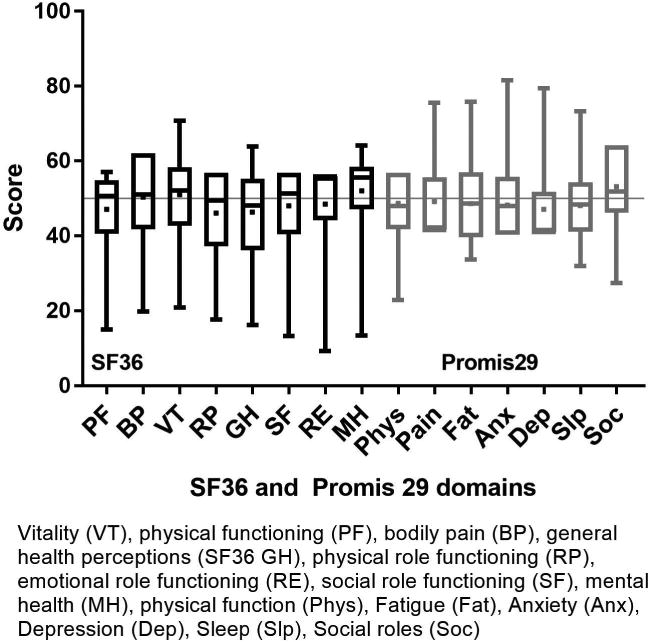
Figure 2a.


SF36 and PROMIS29 domain score distribution in allogeneic HCT recipients. Data are displayed as mean (square), median (line inside the box), Interquartile range (IQR) (top & bottom edges), and extreme values (whiskers). SF36: lower scores indicate worse symptoms and function. PROMIS: for negatively-worded concepts a higher T-score represents more of the concept being measured (depression, anxiety, pain interference, fatigue, sleep disturbance), for positively-worded concepts a higher T-score reflects more (better) of the concept being measured (physical function, social interaction).
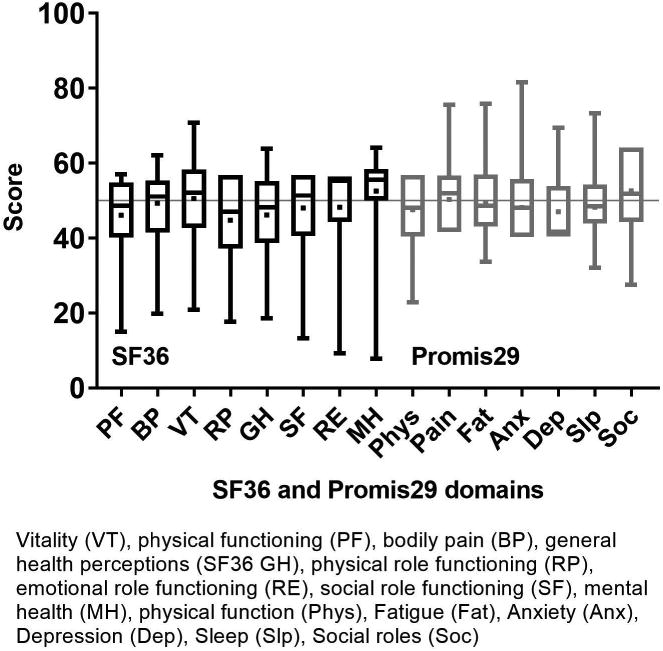
SF36 and PROMIS29 domain score distribution in autologous HCT recipients. Data are displayed as mean (square), median (line inside the box), IQR (top & bottom edges), and extreme values (whiskers). SF36: lower scores indicate worse symptoms and function. PROMIS: for negatively-worded concepts a higher T-score represents more of the concept being measured (depression, anxiety, pain interference, fatigue, sleep disturbance), for positively-worded concepts a higher T-score reflects more (better) of the concept being measured (physical function, social interaction).
