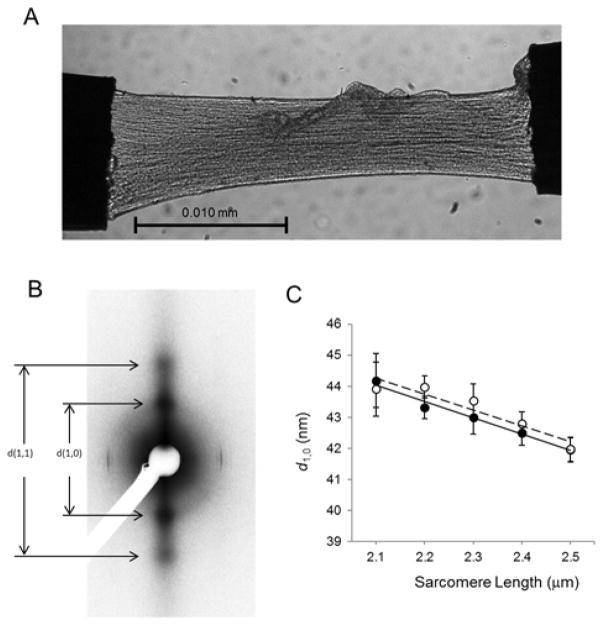
Figure 1. Transmural myofilament lattice spacing in myocardium from a dog animal model.
A-B) Typical CCD image showing LV free wall permeabilized muscle strip (A) and equatorial diffraction pattern obtained from an ENDO dog myocardium (B). C) Myofilament lattice spacing (d1,0) vs. SL relationships obtained in ENDO (open circle) and EPI (solid circle) control dog myocardium. (Data areexpressed as mean±SEM, N=5)

