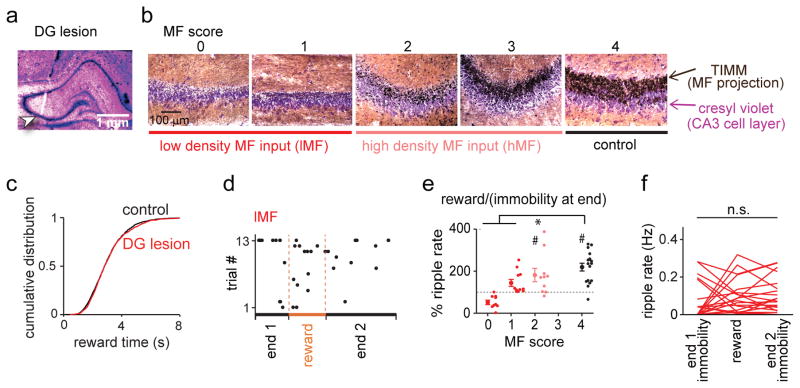
Figure 4. Reward-associated CA3 SWR events were dependent on direct mossy fiber input from the dentate gyrus.
(a) Histological confirmation of a CA3 recording site in a DG-lesioned rat (indicated by arrow). (b) Mossy fiber (MF) density was scored at each recording site in the hippocampal CA3 subregion on a scale from 0 (no MF input) to 4 (control MF input). Scores 0–1 were combined into the low-density MF input (lMF) group and higher scores were considered high-density MF input (hMF) group. Cell bodies are labelled with cresyl violet (purple), and MF of dentate granule cells are labelled with TIMM (black). (c) Cumulative distribution of duration of reward intake (n = 1521 and 1585 in control and lesioned rats, respectively; Dmax = 0.032, P = 0.42, Kolmogorov-Smirnov test). (d) Same as Fig. 3g but for a lMF CA3 recording site in a DG-lesioned animal. (e) Percent ripple event rates during reward compared to periods of immobility on arm ends for each CA3 recording site (dots represent individual CA3 recording sites, grouped by the MF score) (score 0: n = 9 from 6 animals, t(8) = 0.24, P = 0.81; score 1: n = 11 from 6 animals, t(10) = 0.72, P = 0.49; score 2: n = 10 from 5 animals, t(9) = 2.71, P = 0.024; score 4: n = 17 from 4 animals, t(16) = 4.99, P = 1.3 × 10⁻⁴, two-sided paired t test within the group; control vs lMF, U = 211, Z = 3.71, P = 2.0 × 10⁻⁴; control vs hMF, U = 116, Z = 1.18, P = 0.24, two-sided Mann-Whitney U test followed by posthoc Bonferroni corrections). The choice and forced phases are combined (see Supplementary Fig. 9 for additional related analyses). * P < 0.05, comparison across groups; # P < 0.05, reward vs immobility at end within group. (f) For the lMF group, ripple rates did not increase during reward compared to other immobile periods at arm ends (n = 20 tetrodes from 9 DG-lesioned animals; F(2,57) = 0.67, P = 0.52, ANOVA).

