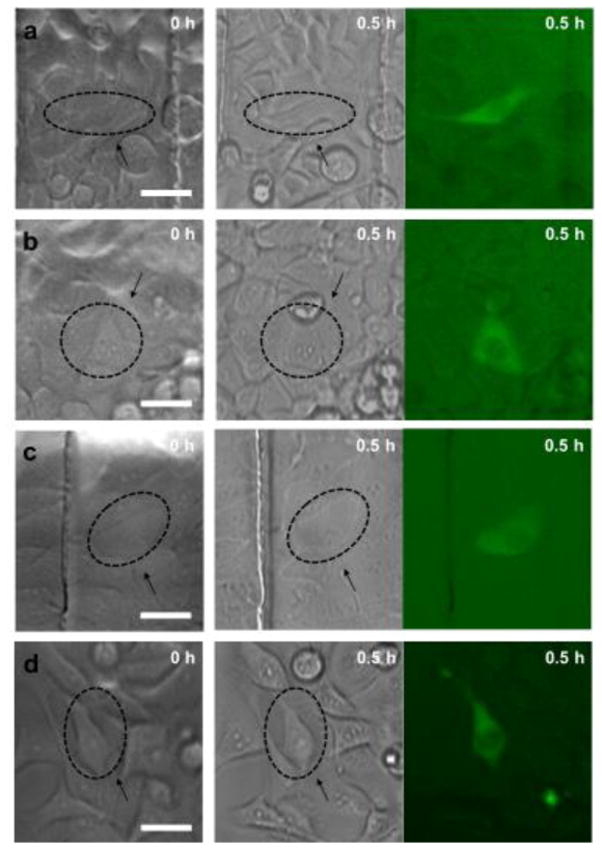
Fig. 4.

Intracellular delivery of 70 kDa dextran labeled with Oregon Green using optimal treatment conditions. Left column indicates bright-field images before the treatment, and middle and right columns show bright-field and fluorescence images after 0.5 hour of the treatment for (a) HeLa, (b) MCF-7, (c) MCF-10A, and (d) MDA-MB231 cell lines. Arrows show treated cells and scale bars indicate 40 μm.
