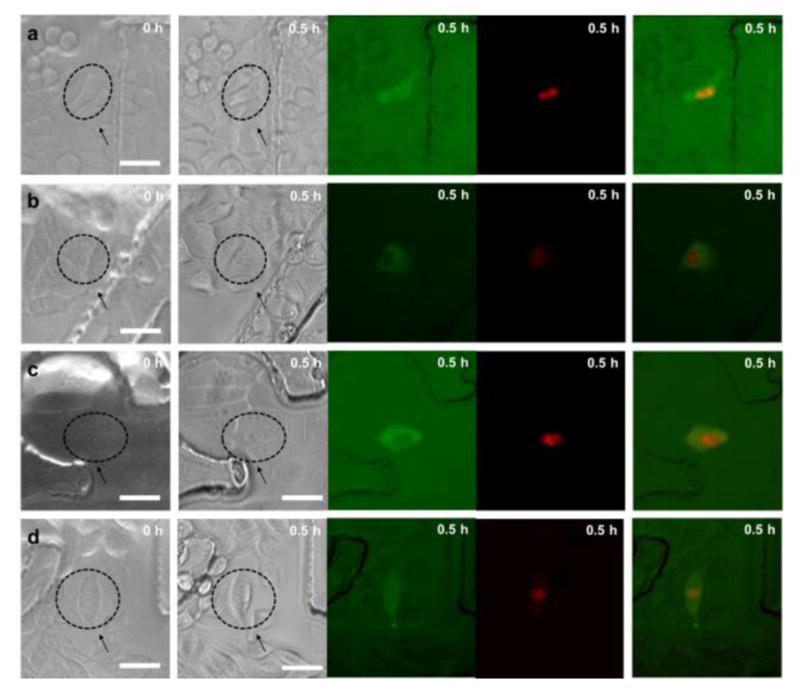
Fig. 5.

Simultaneous intracellular delivery of 70 kDa dextran labeled with Oregon Green and propidium iodide (PI) under optimal treatment conditions. The first and second columns indicate bright-field images before and after treatment, respectively, and the third and fourth columns show fluorescence images of 70 kDa dextran and PI after 0.5 hour of the treatment, respectively, and the fifth columns overlapped images of the two different fluorescence images for (a) HeLa, (b) MCF-7, (c) MCF-10A, and (d) MDA-MB231 cell lines. Arrows indicate treated cells and scale bars indicate 40 μm.
