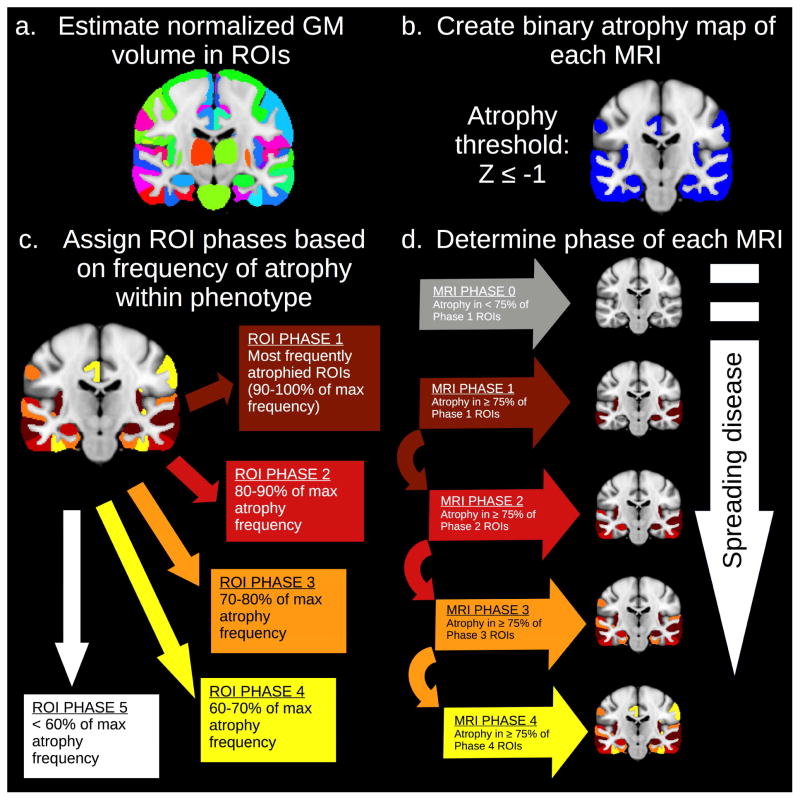
Figure 1.
Frequency-based MRI phase assignment algorithm. Within each patient group, ROIs were ranked by frequency of atrophy. Phase 1 comprised ROIs with an atrophy frequency of 90–100 percent of the maximum frequency; Phase 2 represented ROIs atrophied in 80–90 percent of the maximum; Phase 3 included ROIs atrophied in 70–80 percent of the maximum; and Phase 4 included ROIs atrophied in 60–70 percent of the maximum. ROIs with less frequent atrophy constituted a hypothetical Phase 5, i.e., they were assumed to be atrophic only in late disease stages. Each scan was subsequently assigned the highest phase value for which it exhibited atrophy in at least 75 percent of the corresponding ROIs. Scans that did not meet criteria for Phase 1 are classified as “Phase 0” and assumed to reflect very mild disease progression.

