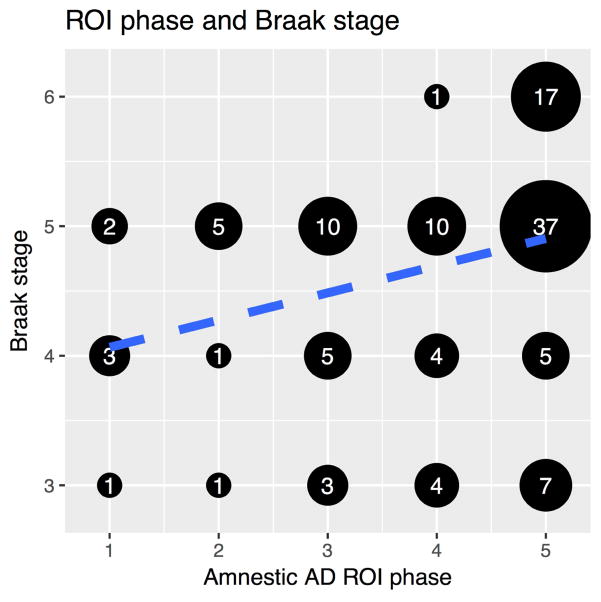
Figure 2.
Scatterplot of ROI phases for the optimal aAD model vs. the stage in which tau neurofibrillary tangle pathology first appears, according to the Braak model. Numbers within each black circle indicate the number of data points overplotted in that circle. The blue line is the best-fit regression line. The optimal aAD model used a Z-score threshold of −1 to determine atrophy and a frequency interval of 10% to distinguish ROI phases. ROI phase was correlated with Braak stage (ϱ=0.35, p<0.001).

