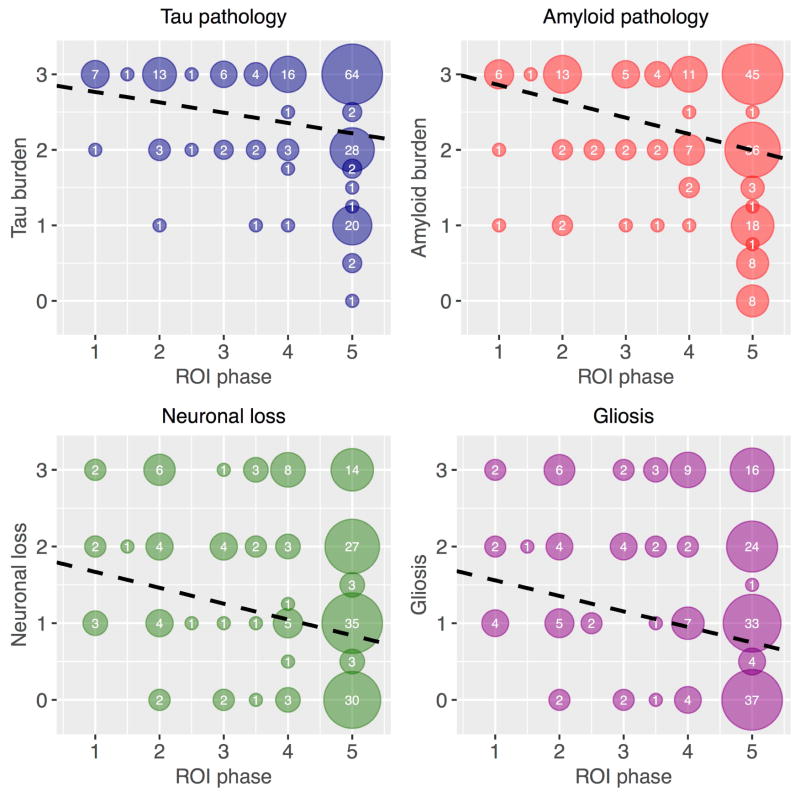
Figure 4.
Associations between ROI phase and regional micropathology ratings. Top left: tau neurofibrillary tangle (NFT) burden; top right: β-amyloid burden; bottom left: neuronal loss; and bottom right: gliosis burden. Each data point represents one of 11 brain areas in one of 17 naAD patients. Numbers within each circle indicate the number of observations overplotted in that circle. The dashed black line in each plot is plotted from the slope and intercept terms of the corresponding linear mixed effects model.

