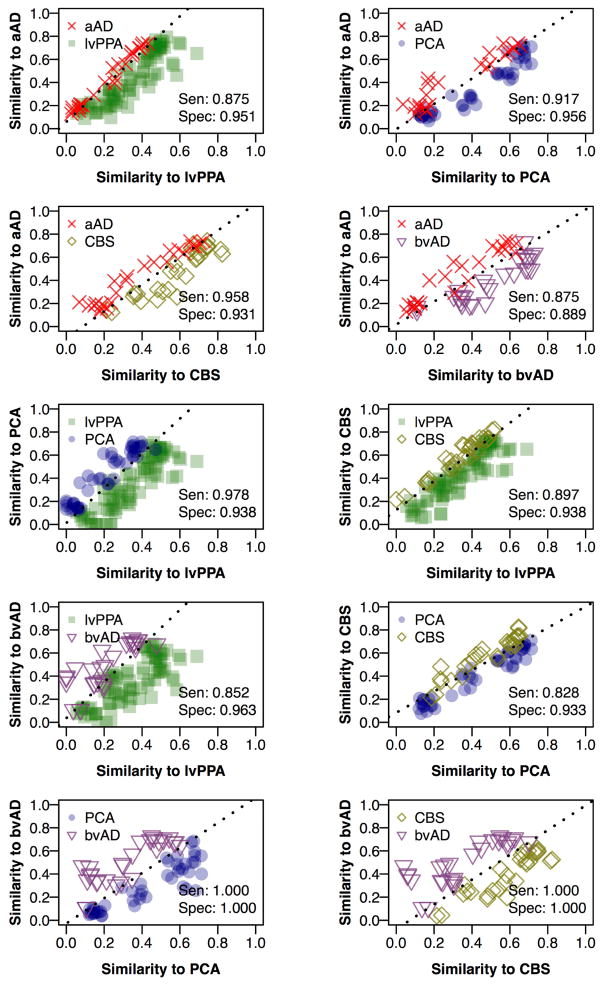
Figure 6.
Phenotype discriminability based on disease progression models. Each panel represents a logistic regression model trained to discriminate between two AD phenotypes. Each point represents a single scan from a patient with one of the two clinical phenotypes. The x- and y-axes represent spatial overlap (expressed by Sorensen-Dice coefficients) between the binary atrophy map for a single scan and the model-predicted atrophy map for the appropriate phenotype and MRI phase. Sen: sensitivity, indicating proportion of scans correctly identified for the phenotype on the y-axis; Spec: specificity, indicating scans correctly identified for the phenotype on the x-axis.

