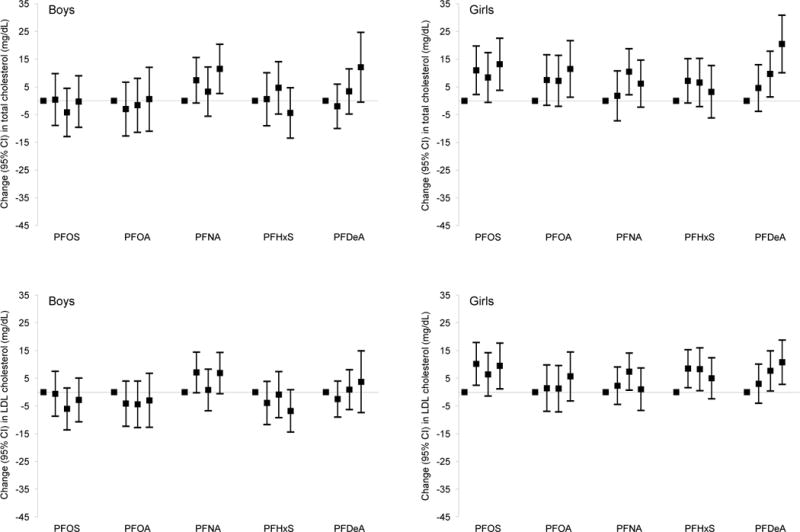
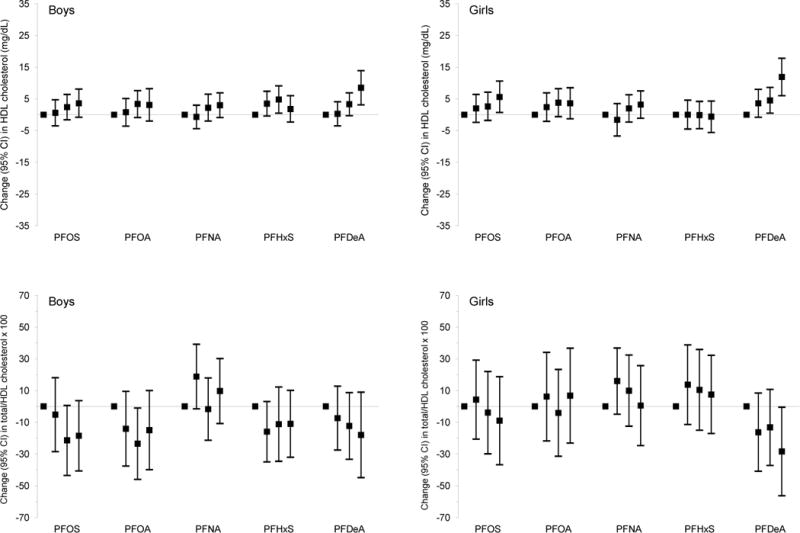
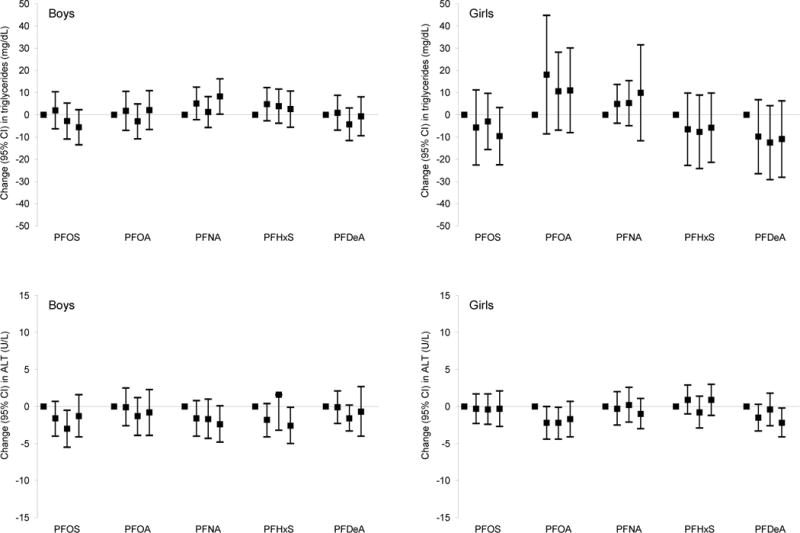
Figure A.2.


Adjusted linear regression coefficients for associations of mid-childhood PFAS quartiles with lipid and ALT levels in mid-childhood among boysa and girls.b
Abbreviations: PFAS, per- and polyfluoroalkyl substances; LDL, low-density lipoprotein; HDL, high-density lipoprotein; ALT, alanine aminotransferase; PFOS, perfluorooctane sulfonate; PFOA, perfluorooctanoate; PFNA, perfluorononanoate; PFHxS, perfluorohexane sulfonate; PFDeA, perfluorodecanoate.
Estimates are presented as change (95% confidence intervals) in outcome for each quartile increment in exposure (exposure quartiles 2–4 vs. quartile 1). Models were adjusted for maternal education, prenatal smoking, and child’s race/ethnicity, and age at lipids/ALT measurements.
aBoys with lipid measurements and PFOS concentrations: quartile 1 (Q1) = 81, quartile 2 (Q2) = 76, quartile 3 (Q3) = 81, and quartile 4 (Q4) = 76; with lipid measurements and PFOA concentrations: Q1 = 76, Q2 = 74, Q3 = 87, and Q4 = 77; with lipid measurements and PFNA concentrations: Q1 = 98, Q2 = 65, Q3 = 74, and Q4 = 77; with lipid measurements and PFHxS concentrations: Q1 = 91, Q2 = 70, Q3 = 67, and Q4 = 86; with lipid measurements and PFDeA concentrations: Q1 = 90, Q2 = 84, Q3 = 100, and Q4 = 40. Boys with ALT measurements and PFOS concentrations: Q1 = 87, Q2 = 76, Q3 = 85, and Q4 = 84; with ALT measurements and PFOA concentrations: Q1 = 80, Q2 = 81, Q3 = 89, and Q4 = 82; with ALT measurements and PFNA concentrations: Q1 = 102, Q2 = 73, Q3 = 81, and Q4 = 76; with ALT measurements and PFHxS concentrations: Q1 = 89, Q2 = 75, Q3 = 73, and Q4 = 95; with ALT measurements and PFDeA concentrations: Q1 = 93, Q2 = 89, Q3 = 105, and Q4 = 45.
bGirls with lipid measurements and PFOS concentrations: Q1 = 75, Q2 = 73, Q3 = 70, and Q4 = 64; with lipid measurements and PFOA concentrations: Q1 = 72, Q2 = 75, Q3 = 63, and Q4 = 72; with lipid measurements and PFNA concentrations: Q1 = 83, Q2 = 66, Q3 = 62, and Q4 = 71; with lipid measurements and PFHxS concentrations: Q1 = 84, Q2 = 67, Q3 = 75, and Q4 = 56; with lipid measurements and PFDeA concentrations: Q1 = 73, Q2 = 68, Q3 = 93, and Q4 = 48. Girls with ALT measurements and PFOS concentrations: Q1 = 77, Q2 = 74, Q3 = 74, and Q4 = 73; with ALT measurements and PFOA concentrations: Q1 = 74, Q2 = 78, Q3 = 70, and Q4 = 76; with ALT measurements and PFNA concentrations: Q1 = 86, Q2 = 74, Q3 = 65, and Q4 = 73; with ALT measurements and PFHxS concentrations: Q1 = 87, Q2 = 69, Q3 = 78, and Q4 = 64; with ALT measurements and PFDeA concentrations: Q1 = 74, Q2 = 72, Q3 = 101, and Q4 = 51.
Wald test p-values for most interaction terms between child sex and mid-childhood PFAS quartiles were not significant [PFOS: for total cholesterol (p = 0.20), for HDL cholesterol (p = 0.88), for total/HDL cholesterol × 100 (p = 0.87), triglycerides (p = 0.75), and ALT (p = 0.62)]; PFOA: for total cholesterol (p = 0.53), for LDL cholesterol (p = 0.67), for HDL cholesterol (p = 0.87), for total/HDL cholesterol × 100 (p = 0.92), triglycerides (p = 0.57), and ALT (p = 0.59); PFNA: for total cholesterol (p = 0.25), for HDL cholesterol (p = 0.99), for total/HDL cholesterol × 100 (p = 0.79), triglycerides (p = 0.94), and ALT (p = 0.72); PFHxS: for total cholesterol (p = 0.67), for HDL cholesterol (p = 0.56), for total/HDL cholesterol × 100 (p = 0.47), triglycerides (p = 0.63); PFDeA: for total cholesterol (p = 0.66), for LDL cholesterol (p = 0.61), for HDL cholesterol (p = 0.65), for total/HDL cholesterol × 100 (p = 0.89), triglycerides (p = 0.71), and ALT (p = 0.30)]. The only exceptions were some interaction terms between child sex and mid-childhood PFOS [for LDL cholesterol (p = 0.10)], PFNA [for LDL cholesterol (p = 0.16)], and PFHxS quartiles [for LDL cholesterol (p = 0.12) and ALT (p = 0.10)].
