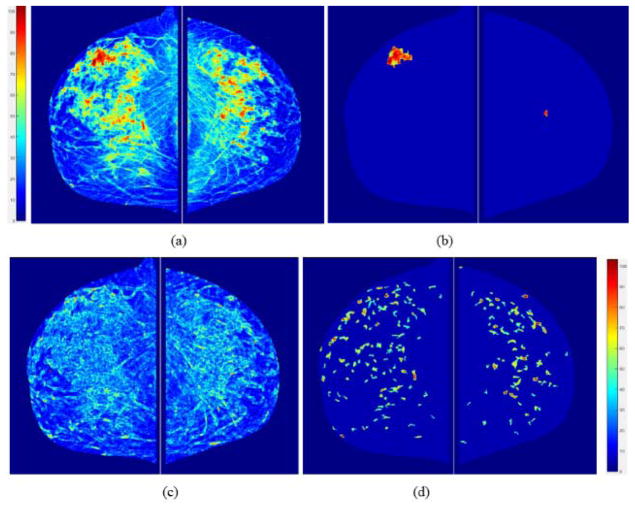
Figure 2.
An example of showing the intermediate results of image processing steps including (a) computed breast tissue density maps, (b) detected focal density regions, (c) local density (pixel value) fluctuation maps, and (d) image maps generated using Gaussian bandpass filtering. Color bars show volumetric density level of the pixel values.

