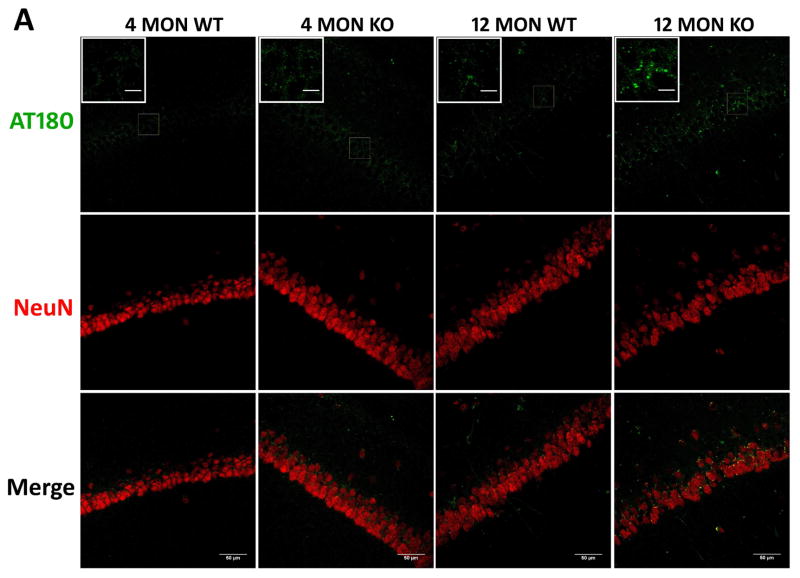
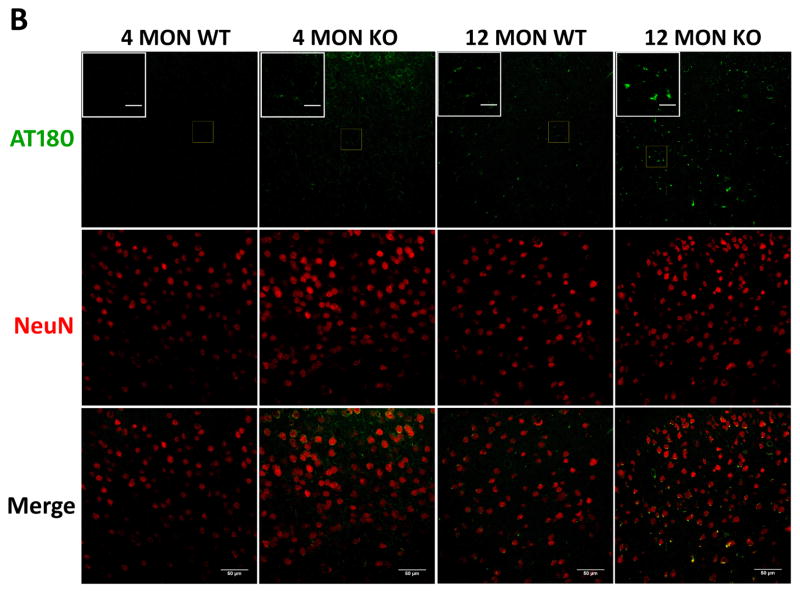
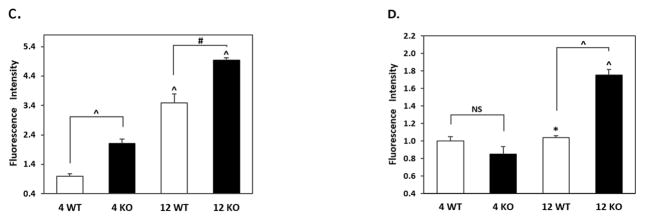
Figure 8. Phospho-T231 tau (AT180) immunostaining in brains of 4 and 12 month WT and Nrf2 (−/−) mice.
(A) Representative immunohistochemical staining for pT231 tau (AT180) (green) and NeuN (red) in the CA1 of the hippocampus. (B) Representative immunohistochemical staining for pT231 tau (AT180) (green) and NeuN (red) in the frontal cortex layer V. In the hippocampus and cortex of 12 month Nrf2 (−/−) mice, pT231 tau (AT180) staining appears to be increased and more punctate compared to WT mice. NeuN was used as a neuron marker Scale bars: 50μm. Higher magnification images are shown in insets, scale bars: 10 μm. Quantitation of AT180 immunofluorescence in the CA1 region of the hippocampus (C) and frontal cortex layer V (D). AT180 fluorescence intensity is presented as mean ± SD (*p < 0.05, #p < 0.01, ^p < 0.001, NS: Not Significant). The symbols over the 12 month bars are comparisons to 4 month data for each genotype.


