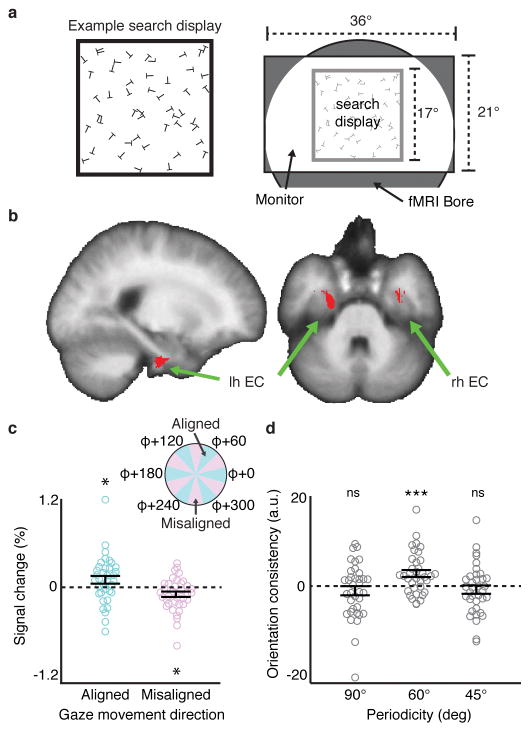
Figure 1. Visual grid-like representation in human entorhinal cortex (EC).
a) Left: example square visual search display (for display purposes, example display has fewer letters than actual displays and relative letter size is increased). Right: schematic of the scene visible during scanning. b) Reliable grid-like coding of visual space was observed in bilateral EC (t-test, p<0.05, SVC in bilateral EC; peak MNI coordinates: 40/−4/−38, peak Z=3.09). c) fMRI response in a 2mm sphere centered on the peak EC voxel from (b) for periods of gaze movement aligned to grid orientation φ (within ±15° of a φ axis) and misaligned (more than ± 15° from all φ axes) (aligned: t-test, t(35)=1.95, p=0.030, sign-test p=0.033; misaligned: t-test, t(35)=−2.60, p=0.014, sign-test p=0.029, two-tailed tests). d) Split-half orientation consistency (beta weight) in the spherical EC voxel ROI from (c) for 90° and 45° periodicities (magnitude of 60° plotted for scale). Neither 90° nor 45° showed significant orientation consistency (90°: t-test, t(35)=−1.15, p=0.87, sign-test p=0.56; 45°: t-test, t(35)=−1.02, p=0.84, sign-test p=0.93). Note that these null effects were not specific to the EC ROI based on the 60° periodicity analysis, as we saw no effect for 90° or 45° in the entire EC at p<0.05 (SVC). Throughout the figure, all statistical tests are one-tailed unless otherwise noted, and n=36 participants; error bars show ±1 SEM; *p<0.05; ***p<0.001; ns, not significant.

