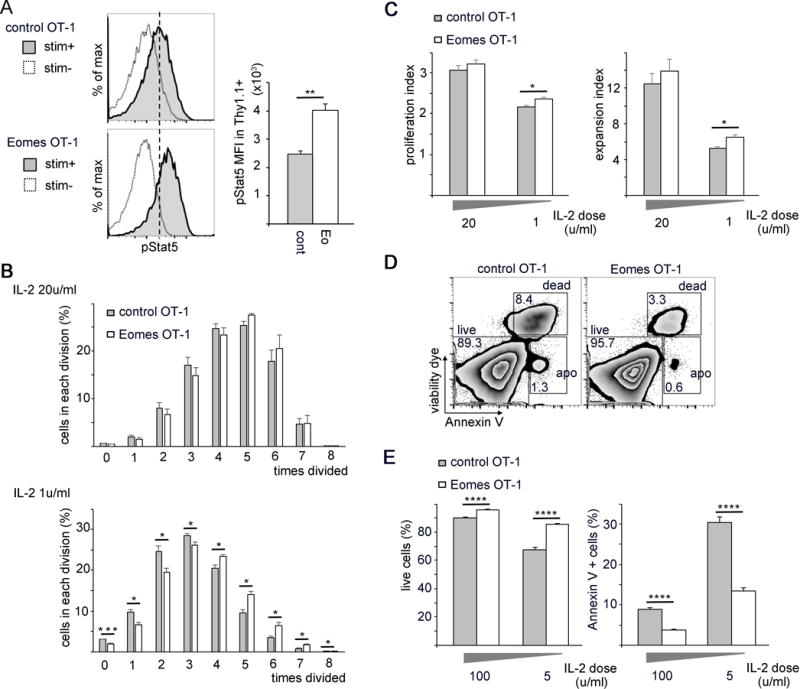
Fig. 6. Increased CD25 expression associated with Eomes expression enhances IL-2 responsiveness and increases IL-2 dependent proliferation and survival.

(A) Levels of phosphorylated Stat5 (pStat5) were analyzed by flow-cytometry in Eomes-OT-1 and control-OT-1 CD8+ T cells. Cells were starved with interleukin-2 (IL-2) and then stimulated with 5u/mL IL-2. Histograms are representative of pStat5 expression in stimulated versus unstimulated cells. The bar graph represents the MFI of pStat5 shown as the mean values with standard error (n=3).
(B–C) Cellular proliferation was analyzed by CFSE staining. CD8+ OT-1 cells were stained with CFSE prior to viral transduction. After 3 days of culture with IL-2 of 20u/mL or 1u/mL, CFSE levels were measured by flow-cytometry and plotted as mean values with standard error. (B) Percentage of cells in each division (n=4). (C) Proliferation index and expansion index calculated from cell numbers in each division shown in B (n=4).
(D–E) Control-OT-1 and Eomes-OT-1 cells were cultured in vitro with 100u/mL or 5u/mL IL-2 for 3 days and stained with viability dye and AnnexinV and analyzed by flow cytometry. (D) Representative FACS plots comparing cell viability in control-OT-1 and Eomes-OT-1 cells cultured in 100u/mL IL-2. (E) Bar graphs represent the percentage of live cells and dead or apoptotic cells in the CD8+ OT-1 cells. Bars are plotted as mean values with standard error (n=4). Each experiment was repeated at least 3 times, data shown were from a representative experiment consists of numbers of samples shown above. Statistical analyses were performed by Student t test; *, p<0.05; **, p<0.01; ***, p<0.002; and ****, p<0.0005.
