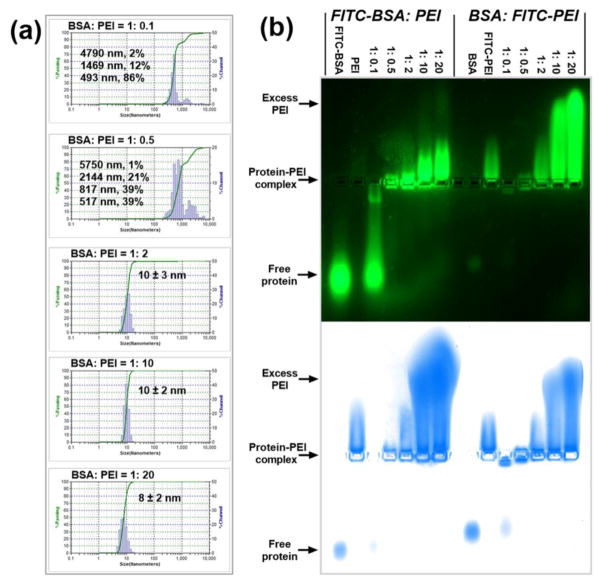
Fig. 2.
Characterization of protein-polycation complex systems. (a) DLS particle size analysis for BSA:PEI complexes at different BSA:PEI mass ratios. The value behind ‘±’ describes the half-peak width of the size distribution. (b) Agarose gel retention assays for FITC-BSA:PEI (the 7 lanes on the left) and BSA:FITC-PEI (the 7 lanes on the right) complexes at different mass ratios. The images were taken before (upper row) and after (lower row) staining by coomassie blue.

