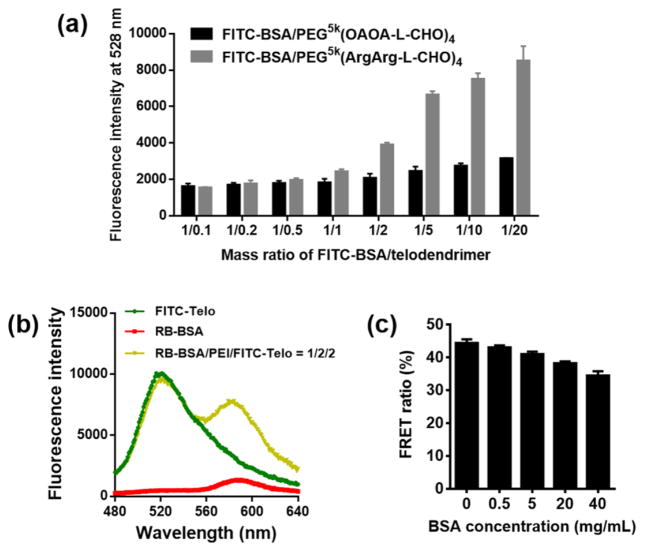
Fig. 5.
(a) Fluorescent intensity of FITC-BSA incubation with either positively (PEG5k(ArgArg-L-CHO)4) or negatively (PEG5k(OAOA-L-CHO)4) charged telodendrimers at different mass ratios of FITC-BSA/telodendrimer. (b) Representative FRET spectra of RB-BSA, FITC-PEG5k(OAOA-L-CHO)4, and RB-BSA/PEI/FITC-PEG5k(OAOA-L-CHO)4 (1:2:2, w/w) complex. (c) FRET ratios of RB-BSA/PEI/FITC-PEG5k(OAOA-L-CHO)4 (1:2:2, w/w) complexes after incubation with non-fluorescent BSA solutions at different concentrations. The errors in a and c are for standard deviation (n = 3).

