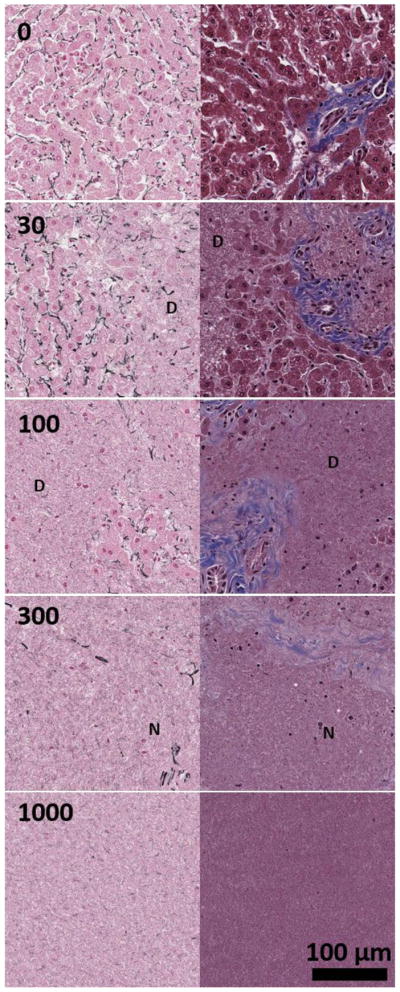
Figure 4.

Sample histology of the liver tissue using Masson’s trichrome (right column) and Gordon & Sweet’s reticulin stains (left column) for histotripsy dosages of 0, (top row), 30 (second row), 100 (third row), 300 (fourth row), and 1000 (bottom row) pulses-per-location. Type I collagen is blue in trichrome stain and reticulin fiber is black in reticulin stain. For 30 and 100 pulses-per-location, areas of destruction are marked with a D. For 300 pulses-per-location, example remnant nuclei are marked with an N. Complete tissue homogenization is observed at 1000 pulses-per-location.
