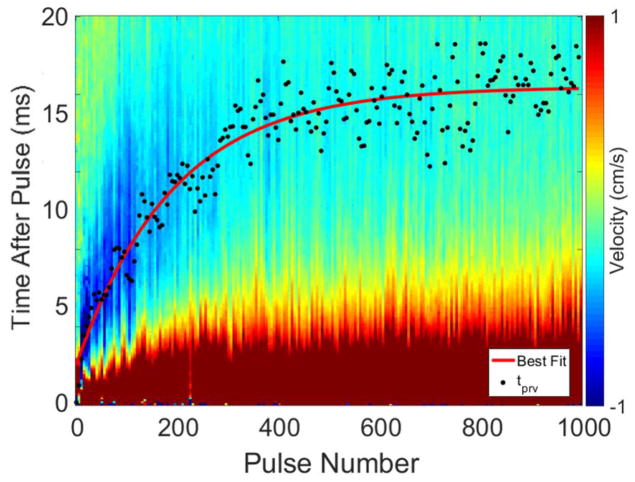
Figure 5.
Example BCD slow-time/fast-time profile from one 1000 pulse treatment. The tprv is indicated by a black point for each pulse number, and a nonlinear least squares best-fit trend line is shown in red. The largest peak negative velocities were on the order of -1 m/s and were observed to have large negative velocities earlier in treatment.

