Fig. 4.
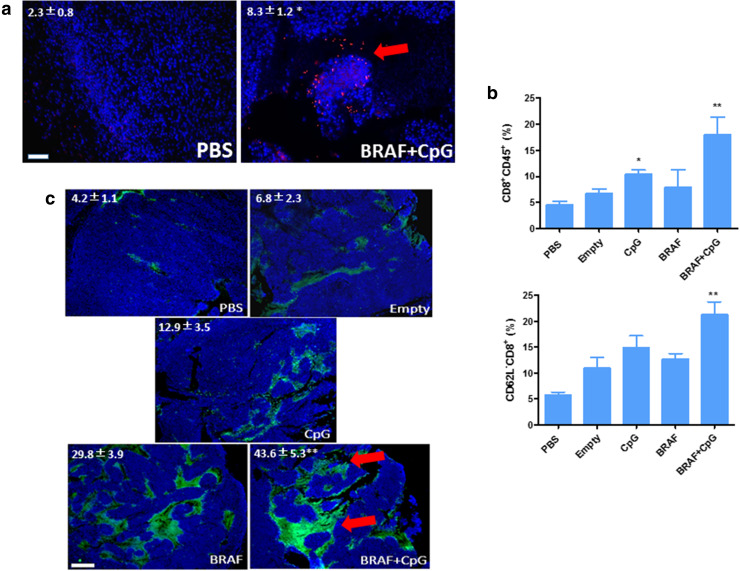
Enhanced T cell infiltration into tumor microenvironment-induced potent CTL killing. a Tissue sections from murine BRAF-mutant model with different treatments were stained for CD8+ (red) and DAPI (blue), then analyzed by immunofluorescence microscopy. Scale bars indicate 200 μm. Arrow indicated infiltrating CTLs. b The percentage of CD8+ T cell (CD8+CD45+) and its activation (CD8+CD62L−) within tumor regions were quantified by flow cytometry. c TUNEL assay indicating apoptotic cell death. Scale bars indicate 300 μm. Arrows indicate apoptotic regions. Numbers in the panel indicate average values of three samples per group, quantified by Image J. *p < 0.05, **p < 0. 01

