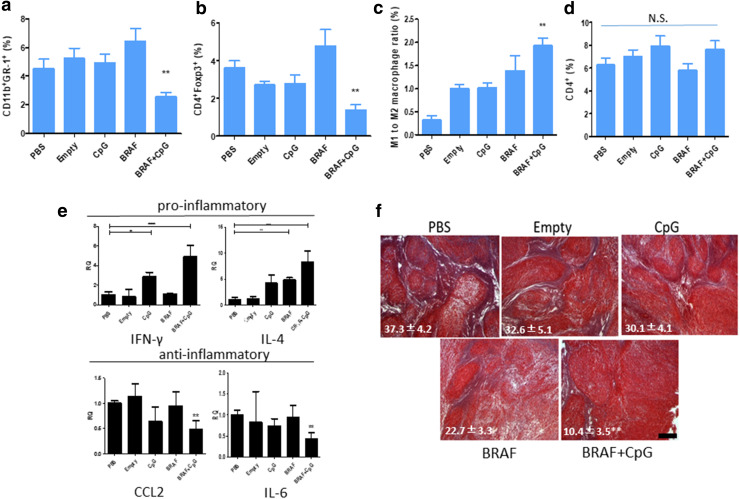
Fig. 5.
Change of TME. The percentage of MDSCs (a), Treg cells (b), M1-to-M2 ratio (c), and CD4+ T cells (d) within tumor regions were quantified by flow cytometry. Rt-PCR elucidated inflammatory cytokine profile within TME (e). Masson’s trichrome staining (f) indicating change in collagen after different treatments. Numbers in the panel indicate average values of three samples per group, quantified by Image J. n = 5. *p < 0.05, **p < 0. 01. Scale bars indicate 300 μm

