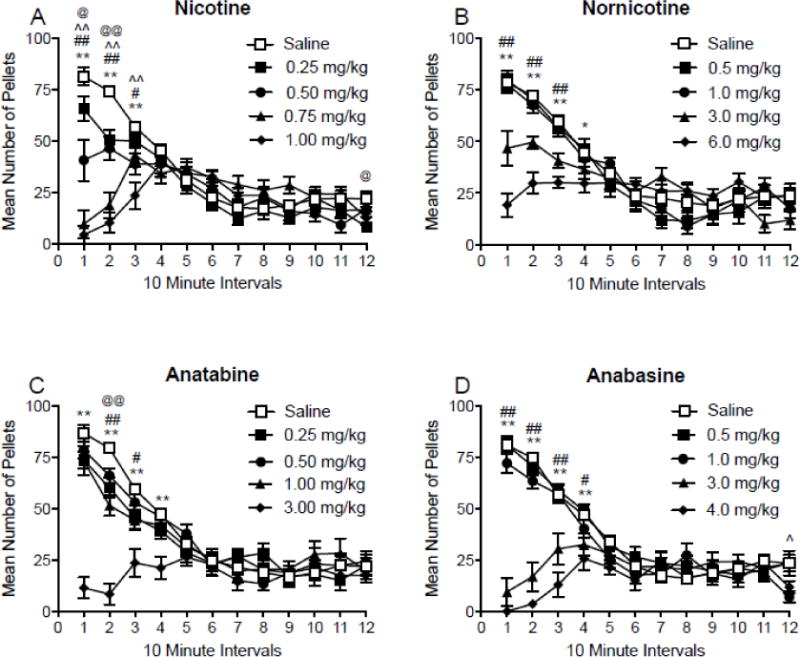
Fig. 3.

Mean (±SEM) total number of pellets consumed during 10-minute intervals throughout daily 2 h experimental sessions, following injections of saline, expressed as the mean intake during these injections, and four doses of nicotine (panel A), nornicotine (panel B), anatabine (panel C), and anabasine (panel D). @p < 0.05, @@p < 0.01 difference between saline and the lowest dose tested; ^p < 0.05, ^^p < 0.01 difference between saline and the second lowest dose tested; #p < 0.05, ##p < 0.01 difference between saline and the second highest dose tested; *p < 0.05, ** p < 0.01 difference between saline and the highest dose tested. Note that the dose ranges and intervals differ between panels.
