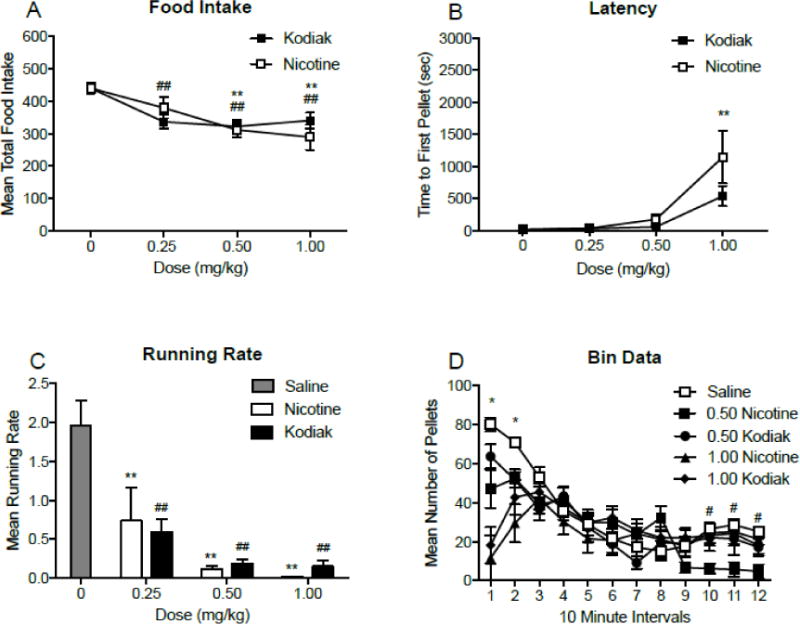
Fig. 5.

Panels A-B: Mean (±SEM) total food intake (panel A), time to first pellet (sec; panel B), throughout daily 2 h experimental sessions, following injections of three doses of nicotine and Kodiak extract. **p < 0.01 difference between saline and nicotine at the indicated dose. ##p < 0.01 difference between saline and Kodiak extract at the indicated dose. Panel C: Mean (±SEM) running rates, following injections of saline, nicotine, and Kodiak extract. **p < 0.01 difference between saline and nicotine at the indicated dose. ##p < 0.01 difference between saline and Kodiak extract at the indicated dose. Panel D: Mean (±SEM) total number of pellets consumed during 10 minute intervals throughout daily 2 h experimental sessions, following injections of two doses of nicotine and Kodiak extract. *p < 0.05 difference from saline at all drugs and doses tested. #p < 0.05 difference between saline and 0.50 mg/kg nicotine.
