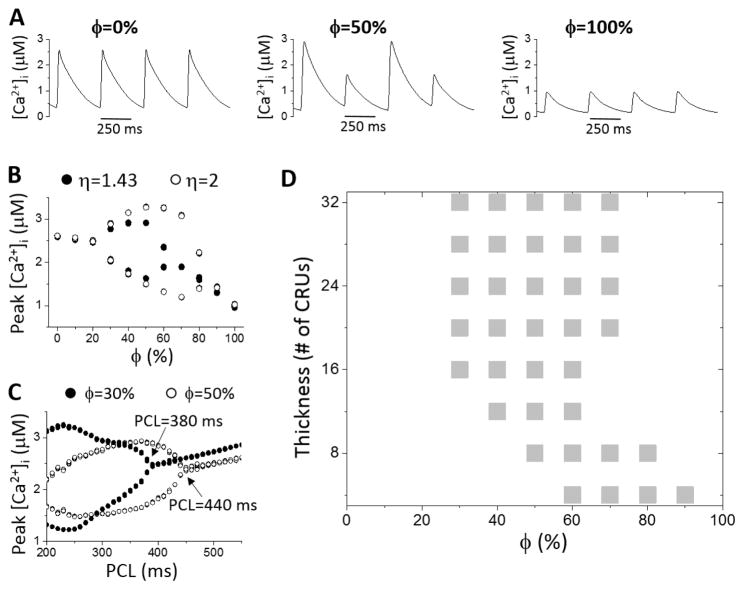
Figure 2. Effect of OCRU ratio and cell size on Ca2+ alternans.
A. [Ca2+]i versus time for ϕ=0, 50%, and 100%. PCL=360 ms. Lz=16 CRUs. B. Peak [Ca2+]i versus ϕ for η=2 (open circle) and 1.43 (filled circle). PCL=360 ms. Lz=16 CRUs. C. Peak [Ca2+]i versus PCL for ϕ=30% (filled circle) and 50% (open circle). Lz=16 CRUs. Arrows indicate the onset of Ca2+ alternans. D. Occurrence of Ca2+ alternans (gray boxes) versus cell thickness and ϕ.

