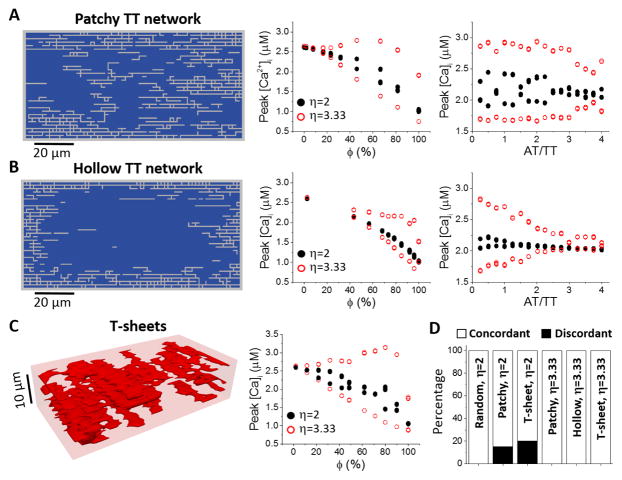
Figure 4. Effects of different non-uniform TT network structures on Ca2+ alternans.
A. Patchy TT networks (random walk length was 360 steps). Left: A 2D slice from a generated 3D TT network. The slice is normal to the Z- line and is the 7th layer in a total of 16 layers along the Z- line. Middle: Peak [Ca]i versus ϕ for AT/TT=3. Right: Peak [Ca2+]i versus AT/TT ratio for ϕ~50%. PCL=360 ms. Since ϕ is not a preset parameter, we generated random TT networks with ϕ between 48% and 52%. B. Hollow TT networks (random walk length was 72 steps). Plots are the same as in A. C. T-sheet structures. Left: An example of sheet- like TT structure. Right: peak [Ca2+]i versus ϕ for η=2 and 3.33. D. Percentage of discordant alternans for different types of TT network structures and η values as indicated. In all cases, ϕ=50%±2%. For each case, we performed 20 simulations with different randomly generated TT network structures.

