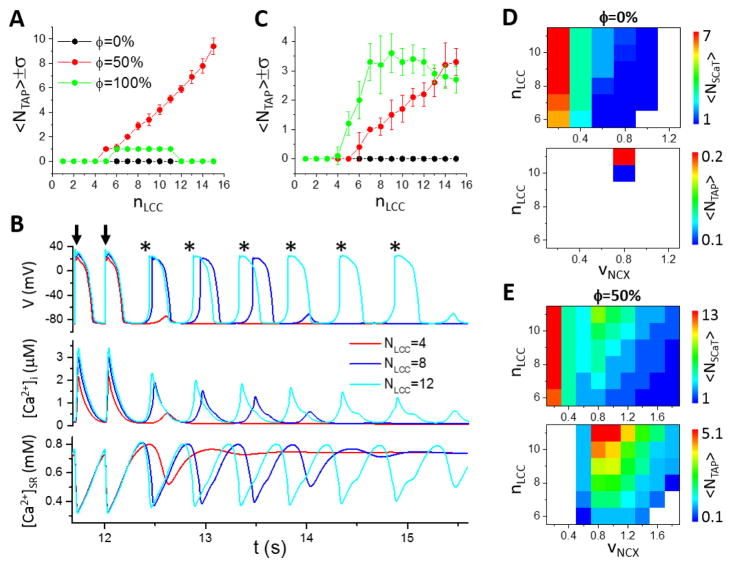
Figure 7. Effects of LCC cluster size and NCX strength on TA.
A. <NT AP> versus nLCC for ϕ=0 (black), 50% (red) and 100% (green). Lz=32 CRUs. Error bars indicate the standard deviation over 10 simulations. B. Time traces of membrane potential (top), [Ca2+]i, (middle), and [Ca2+]SR (bottom) for nLCC=4, 8 and 12 with ϕ=50% as in A. Arrows indicate paced beats. Triggered APs are marked by *. C. Same as in A, but Lz= 8 CRUs. D. Spontaneous Ca2+ release and TA for ϕ=0. For each parameter set (nLCC and vNCX), <NSCaT > and <NT AP> were obtained by performing 20 simulations, each with a randomly generated uniform TT network structure. Upper: <N SCaT > versus nLCC and vNCX. Lower: <NT AP> versus nLCC and vNCX. E. Same as D but for ϕ=50%.

