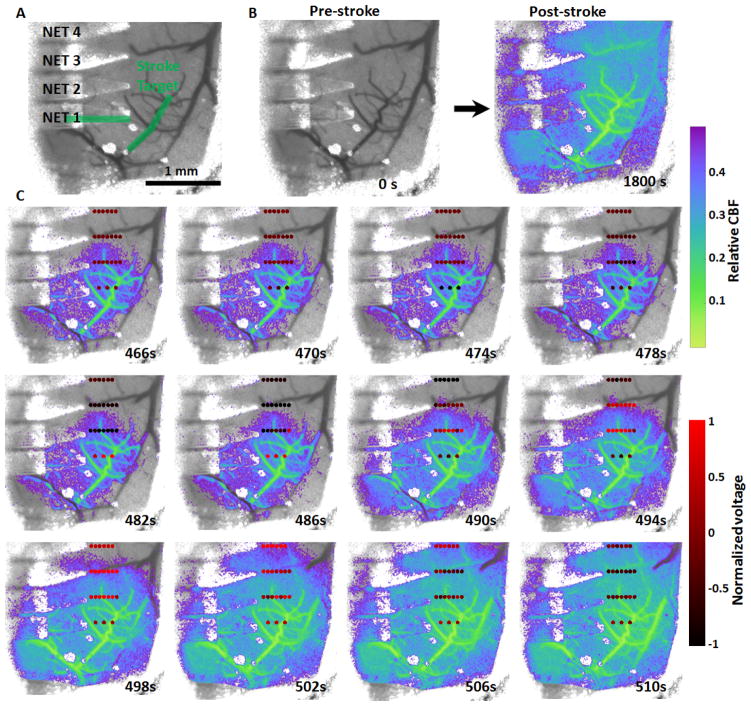
Fig. 2. Simultaneous mapping of relative CBF and cortical potential during a peri-infarct depolarization event.
A: Baseline LSCI showing the location of NETs and the targeted arterioles for photothrombosis (green). Note that one of the arterioles is under the NET. B: LSCI of relative blood flow pre- and post-stroke induced by targeted photothrombosis under 532 nm illumination. C: An ischemia-induced peri-infarct depolarization event that results in significant changes in cortical potential and the expansion of blood flow deficit. The dots mark the locations of individual electrodes on the NETs and are color-coded by the normalized potential.

