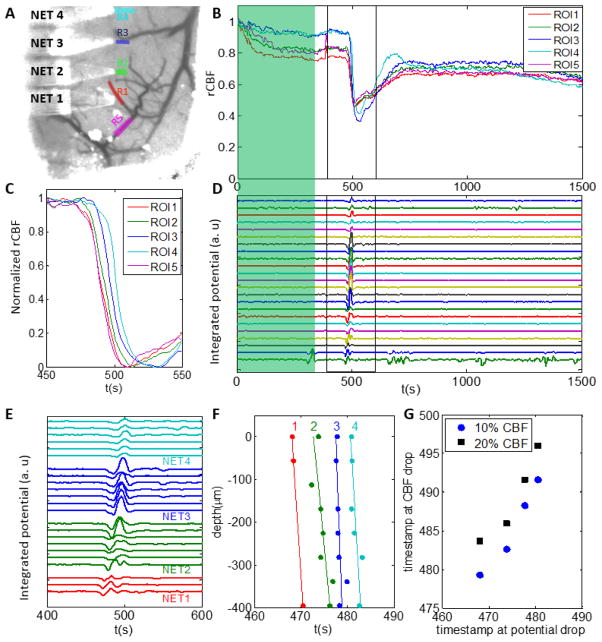
Fig. 3. Concurrent recording of neural potentials and rCBF at nearby locations.
A: ROIs overlaid on pre-stroke LSCI. ROI1 – 4 are chosen next to the NET electrodes and ROI5 is chosen on the targeted arteriole for occlusion. B: rCBF of ROIs during photothrombosis (green shade) and subsequent 25 minutes, highlighting the drastic decrease in blood flow when PID occurred. C: rCBF baselined at t=450s showing the time latency of flow reduction among ROIs during the PID event. D: Neural potential recorded from 22 electrodes on 4 shanks of NETs during photothrombosis (green shade) and subsequent 25 minutes, highlighting the potential change when PID occurred. E: Neural potential changes near the PID event, showing time latency among different shanks and within individual shanks. F: The onset of the potential decrease at different shanks (labeled by the number atop) and depths. G: The time latency between neural potential decrease recorded by the topmost electrode on each shank and rCBF decrease. Two thresholds (10% and 20% decrease of CBF baselined at t=450s) were used.

