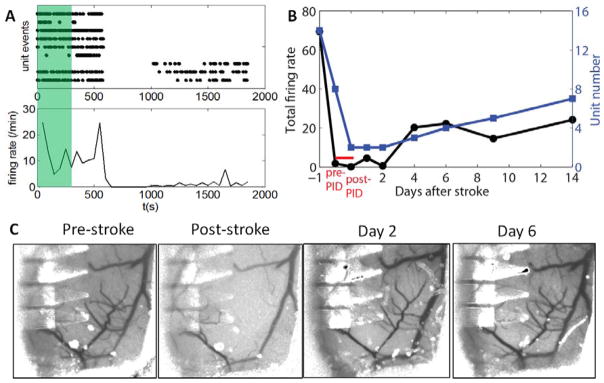
Fig. 4. Recovery of neural activity and reperfusion over days after photothrombosis.
A: single-unit firing events plotted as dot (top) and firing rate per min (bottom) during photothrombosis (green shade) and subsequent 25 min. B: The total firing rate from all recorded units (left) and number of recorded units (right) as a functions of days after stroke. The 30 min session in A is divided to pre- and post- PID, both taken under anesthesia. C: Repeated LSCI at the same brain region showing progressive reperfusion of the occluded vessels after photothrombosis.

