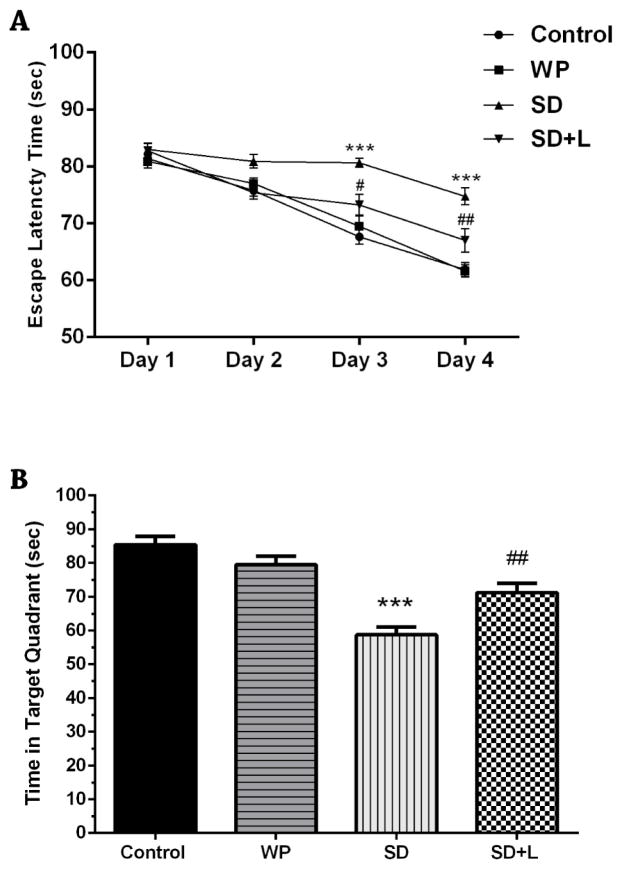
Fig. 2.
A) Mean escape latency time of the four groups of mice during the four days of training sessions and B) mean time spent in the target quadrant in the probe session. Values represent Mean±SEM. ***p<0.001 compared with the control. #p<0.05 and ##p<0.01 compared with the SD. (WP, wide platform; SD, sleep deprived; L, laser).

