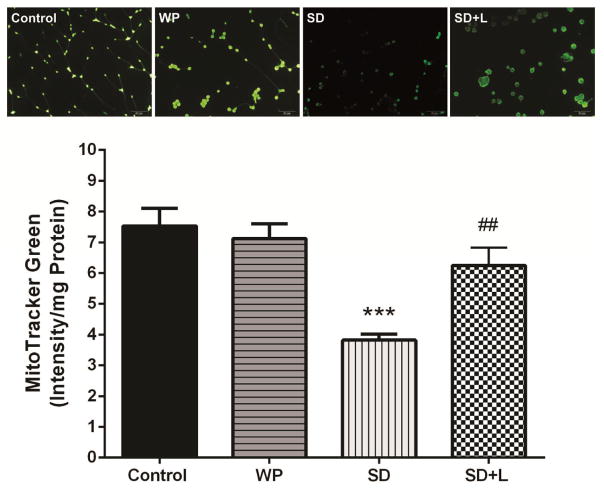
Fig. 4.
The MitoTracker Green (MTG) staining (upper panel) and mean values of MTG fluorescence intensity/mg protein (vital mitochondria index) (lower panel) in different groups. Each bar represents the mean±SEM. ***p<0.001 compared with control. ##p<0.01 compared with the SD. (WP, wide platform; SD, sleep deprived; L, laser).

